Listening to the Sound of the Universe


Sonification: Ryan McGee , UCSB Media Arts Technology Group
Web design and graphic interface: R.J. Duran, Jr., UCSB Media Arts Technology Group
Content: Dr. Jatila van der Veen , UCSB Experimental Cosmology Group
and Professor Lloyd Knox , UC Davis Cosmology Group
Note: The applications are written in WebGL. Minimum system requirements:
  • Mac OSX 10.6.8 or above
  • Windows 7 or above
  • Google Chrome 29.0.1547.65
  • Safari 6.0.5 (Requires at least OSX 10.7 or 10.8)
  • We apologize, but at this time Firefox is not supported.

If you are using Google Chrome and have trouble seeing the applications, make sure WebGL is enabled in your browser settings. If you go to chrome://gpu, you should see "WebGL: Hardware accelerated" under "Graphics Feature Status", indicating WebGL is working. Verify that WebGL is enabled by going to http://get.webgl.org/. You should see a spinning cube. It is possible for the application to work on Windows XP if you have a graphics card that supports WebGL. To find out if your graphics card supports WebGL, see https://www.khronos.org/webgl/wiki/BlacklistsAndWhitelists for further support.


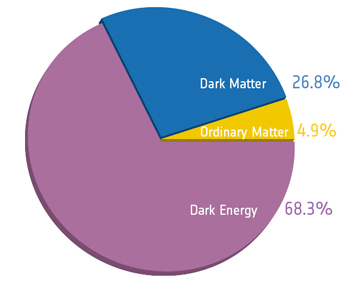
The Cosmic Microwave Background (CMB for short) is the oldest light we can observe, coming to us from a time when the Universe was just 370,000 years old, approximately 13.8 billion years ago. The high-precision map of the CMB that has been produced by the Planck Satellite has allowed us to make the most precise determination of the composition of the universe, after more than twenty years of research.

Normal matter (also called baryonic matter), that makes up stars and galaxies, planets and living things, contributes just 4.9% of the universe's total mass/energy inventory. Dark matter is detected indirectly by its gravitational influence in a number of settings, including its influence on stars and gas in galaxies and on gas and galaxies in clusters of galaxies. Like baryonic matter, it becomes clumpy under the influence of gravity. Dark energy, in contrast, is a smoothly distributed substance which provides an explanation for the observed acceleration of the expansion of space. We find we need dark matter and dark energy to explain the CMB data, with dark matter accounting for 26.8% of matter/energy and dark energy for 68.3%.

Pie chart showing percentages of normal matter, dark matter, and dark energy.
Source: European Space Agency

Here is our most detailed map of the Cosmic Microwave Background, or CMB, as measured by the Planck Mission. It is a picture, in false color, of the baby universe, 13.8 billion years ago, when the universe was 370,000 years old. Click and drag your mouse anywhere in the map to spin it around and see the baby picture of the universe from all sides.

The colors represent the variations in the temperature of the CMB, slightly warmer (orange) and slightly cooler (blue) than the average temperature of space, 2.726 Kelvin. The hot and cold spots indicate regions that were slightly more dense and less dense than average in the first 370,000 years of the universe, which eventually led to the formation of the structure in the universe we see today.

As the universe cooled and expanded, the dark matter began to collect into clumps, while the photons and baryons (protons, electrons, and a few helium nuclei) were tightly bound in a plasma. This action created pressure waves in the plasma of the baby universe, like rocks dropped into water set up waves. These pressure waves in the young universe were just like sound waves, except with extremely long wavelengths of hundreds of thousands to 1 million light years!

When the universe cooled down to around 3,000 Kelvin, it was cool enough for Hydrogen atoms to form. With the electrons tucked away in the atoms, the light could then begin to travel freely . Some of that light headed our way and is observable today as the cosmic microwave background. That light allows us to see the patterns that resulted from the oscillations of the sound waves.

The graph below is the Temperature Power Spectrum of the CMB. Certain wavelengths of sound got amplified by the acoustic oscillations more than others, as indicated by the series of peaks in the power spectrum. The sound waves contributing to the first peak have wavelengths of about 1 million light years, making them about 48 octaves below the lowest note on the piano!

We have translated the sounds of the primordial universe, as we see them today, into the range of human hearing. High frequency sounds correspond to small-scale structures on the map, and low-frequency sounds correspond to larger-scale features in the map, just like high frequency sounds correspond to shorter wavelengths of sound that we hear in air at sea level, while low frequency sound corresponds to longer wavelengths of sound that we hear in air at sea level.


The CMB Temperature Power Spectrum,
Best-fitting models, Planck Mission, 2013


bandwidth 
highpass   
lowpass     


You can focus in on the harmonics by sliding the bandwidth slider (top) to the left. This will produce a more bell-like tone.

The high pass and low pass sliders allow you to listen to isolated parts of the sound. Sliding the high pass filter to the right cuts out the lower tones, while sliding the low pass filter to the left cuts out the higher tones.

By using the two filters together, you can 'zoom in' on one or more harmonics, find the lowest sound you can hear, or simply create interesting sound effects.

The power spectrum of temperature variations in the CMB tells us something about the composition of the universe: how much normal matter, dark matter, and dark energy there is; how old the universe is; how fast it is expanding; and how long it took for the universe to become transparent. The rise in the power spectrum at the very low end (long wavelength) is explained by the accelerated expansion of the universe due to dark energy, which stretches the gravitational 'hills and valleys' that the CMB photons travel through on their way across space and time to our detectors. (See discussion HERE by Professors Douglas Scott and George Smoot for an explanation of this effect (Integrated Sachs-Wolfe effect, or ISW).) The very small fluctuations at the highest end (shortest wavelengths) tell us something about the way clumps of matter in the 'foreground' act like gravitational lenses that distort the CMB signal. For more detailed discussion of the meaning of features in the CMB temperature anisotropy power spectrum, see discussion on the WMAP website .

To download our Sonification of the CMB application, with which you can compare the sounds of 15 different model universes with different compositions, click HERE .