|
Globular Clusters: Independent Evidence for the Age of the Universe |
|
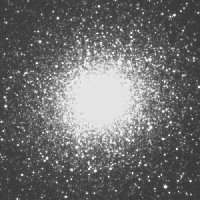
Globular clusters are ancient groups of about 105stars, gravitationally bound together, and thought to be among the oldest stellar structures in the Universe. Globulars are found in abundance orbiting the central bulge of our galaxy in highly elliptical, eccentric, and inclined orbits. In fact, the distance to the center of our galaxy was first found by measuring the distribution of globular clusters. Through a small, backyard telescope they look like fuzzy white cotton balls in the sky...
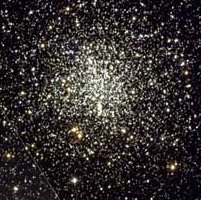
What makes them so useful in determining the age of the universe is that they are a population of stars that formed at the same time, all lie at the same distance from us (neglecting the depth of the cluster, which is tiny compared to its distance), but we see them at different stages in their evolution. Some are relatively young, hot, blue O and B type stars; some are middle aged like our Sun; and some are old white dwarfs, while others are red. A true-color image of M15 taken by the Hubble Space Telescope shows different color stars in this globular cluster:
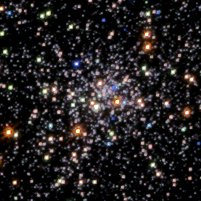
M15
Although all the stars in a globular cluster formed at the same time, they did not all start out with the same masses - and that is why we see the population at different ages. Stars exhaust their hydrogen fuel at a rate that depends on their initial mass. Stars with more "fuel" burn hotter and faster, and die younger than less massive stars, which burn slower and cooler, and live longer.
In general, the life expectancy of a star can be estimated as the
Amound of Fuel / Rate of Fuel Consumption
which is equal to its Mass / Luminosity
.
Luminosity and mass are related by L = M3.5
The evolution of stars over their hydrogen-burning life times is well understood. The graph of luminosity or magnitude vs. temperature for any population of stars shows which ones are on the "Main Sequence" (hydrogen burning), which have exhausted their hydrogen fuel and are into a later stage of evolution, as well as those which are just forming and have not yet reached temperatures sufficient to start fusing hydrogen into helium in their cores.
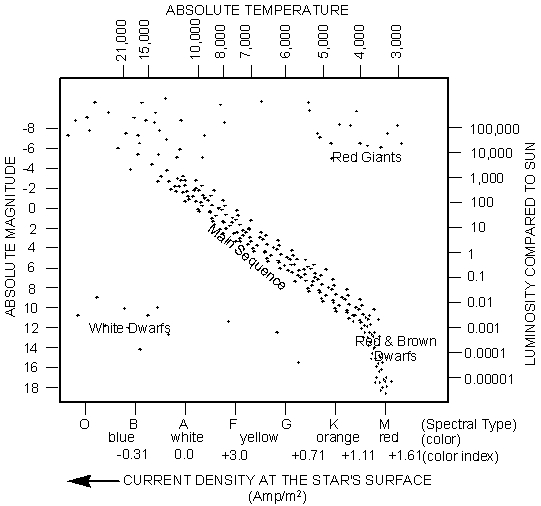
If you can measure the luminosities and temperatures of hundreds of stars in a star cluster, and find the approximate luminosity at which the stars "turn off" the main sequence, that luminosity gives you an estimate of the age of the cluster, in terms of solar "lifetimes" - that is, relative to the expected life of the Sun, which is around 10 billion years.
To summarize:
- Let T = life expectancy of a star, relative to the Sun.
- We know that T = Mass/Luminosity and Luminosity = Mass3.5
- so we substitute and get T = 1/L(2.5/3.5) = 1/L.7143, where L is the luminosity relative to our Sun, and T is its age in units of 10 billion years.
- Alternately, using the same relationship in (2), we get T = M/M3.5 = 1/M2.5
Note that here M is ABSOLUTE MAGNITUDE, in terms of Solar Magnitudes. For example: The Sun has an absolute magnitude M = 4.83. A star of absolute magnitude M = 4.0, for example, has an absolute magnitude in terms of Solar Magnitudes of 4.0/4.83 = 0.828. In other words, it is brighter than the Sun.
What to do next:
- You need to either know the distance from some independent measurement, or you have to measure it spectroscopically.
- The distance gives you an approximate idea of the dimming due to interstellar extinction: approximately 0.1 magnitude per 1,000 pc. You have to subtract this factor from the magnitude you measure for the turnoff point, because this gives you an idea of how much brighter the stars would appear if it were not for the dimming by interstellar dust.
- Using this corrected value for the apparent magnitude at the turnoff point, use the relationship between distance and apparent magnitude and absolute magnitude:
"Mu" = 5log(d) - 5 = apparent magnitude - Absolute Magnitude
where "Mu" is the distance modulus, and d is the distance in pc.
- From this, you calculate M, the Absolute Magnitude at the turnoff point.
- Divide this by 4.83, the Absolute Magnitude of the Sun, to get the absolute magnitude in terms of solar magnitudes. Use this value in the next equation.
- Now you take 1/M2.5 and find the age of the cluster in tens of billions of years (because 1 solar lifetime is 10 billion years, and this relationship gives age in terms of solar lifetimes).
So, we need two independent measurements to do this: One is the absolute magnitude of the stars; the other is some way of measuring their surface temperatures. Since the color of starlight is a measurement of the temperature of a star, the temperature can be estimated by comparing the amount of light output of the star as measured through different colored filters. This measurement is called a color index . To measure colors and temperatures of stars, astronomers do "UBVRI photometry" - that is, they take pictures of stars with Ultraviolet, Blue, Visual (or green filter band), Red, and Infrared filters, and measure the total light output of the stars through all the filters combined. The most commonly color index is the "V-B" index. (Note: V stands for Visual, not Violet, and is centered on the green spectral band, where your eyes peak in sensitivity.)
The process of measuring the magnitudes of stars from images is called photometry. In the "olden days" this was done by measuring the diameter of a star on a photographic plate, and comparing it to the diameter of a star of known magnitude on the same plate. The process today is done with digital images, and with software that tries to do the same procedure mathematically as people's eyeballs used to do visually.
It is a rather tedious process to do B-V photometry on a star cluster. One has to measure hundreds of stars in a cluster, get their B and V magnitudes, subtract to get their color indices, and then plot on an HR diagram to get their turn-off points, and estimate the age of the cluster. Never the less, with the incredibly deatiled images from the Hubble Space Telescope's Wide Field Planetary Camera, astronomers have been able to do accurate B-V photometry on globular clusters around our galaxy, and determine their ages. Their ages then provide a lower limit on the age of the Universe which gives an independent check on the age derived from other observations.
| |
In this Lambda Lab #2 you will... |
|
-
Learn how a digital image is taken, and how digital images are analyzed;
-
Learn how to use some state-of-the-art image processing software for the PC that we have developed in our lab for digital imaging of astronomical objects;
-
Use HST images of the core of globular cluster M12 (NGC 6502)to do some B-V photometry for this cluster;
-
Experience the inherent frustrations in the system...
-
and finally... use the B and V values for this cluster that are given on the HST website, graph the B-V values in Excel and create your own HR diagram, and estimate the age of the cluster from its turn-off point.
| |
Here's some background reading to get you started: |
|
| |
(1) Graphing B-V values for M12 and calculating the age of the cluster from the turnoff point on the HR diagram: |
|
- First, go to the directory Globulars and
download all the files.
- Open the Excel file in the folder "Globulars/HST-M12_forB-V" called "Globulars/HST-M12_forB-V called "M12-B-V_data.xls."
These are magnitudes for M12 in B and V filters, taken with the Hubble Space Telescope, and calculated using the professional
software IRAF. I got these data from the
European Homepage for the NASA/ESA
Hubble Space Telescope .
- Next, open the Excel file "M12-B-V_graph.xls." from the same directory, and copy the data from the
data file into the first two columns in the graph-ready file. You will see the H-R diagram for M12 appear in the graph!
- Write down the apparent magnitude at the turnoff point.
- The distance to this star cluster is 4.9 x 10³ parsecs. Given that the extinction due to
interstellar dust is approximately 0.1 magnitude per 1,000 pc, we can estimate the extinction factor as .5 for this cluster.
(Actually, on the ESA website, they give it as .57.)
- Subtract the extinction factor from the apparent magnitude to get the apparent magnitude that would be measured
if there were no interstellar medium.
- Calculate the distance modulus, "Mu" = 5 log(d) -5.
- Calculate the Absolute Magnitude, M = m - "Mu".
- Divide by 4.83 to get the Absolute Magnitude in terms of Solar magnitudes.
- Now use the formula above, T = 1/M2.5 to get the age in terms of solar life times. Hint: If you get a number less than the age of the Sun, 10 x 1010 years, you did something wrong... this cluster is older than the Sun!
| |
(2) Photometry on M12 using Image-32 from UCSB |
|
These directions pertain to the software Imagine-32. If you use different image processing software, just
do the equivalent operations in your software of choice.
From your desk top, open the Image processing program - the one with the little "telescope window" icon. If it is not already installed, you will need to install it by going into the folder on the CD called "Image-32_release-v-107r", and clicking on the ".msi" file. The software will install itself. It may give you an error message; just ignore it - the program will run.
Click on "File" and open the images "Bcomb.fts" and "Vcomb.fts" in the directory "HST-M12_forB-V". These are corrected images, already aligned for you, from the ESA Educational website, mentioned above.
Get the magnitudes for stars you select:
- Select "View" from the top menu bar;
- Select "Photometry" from the drop-down menu:
- Click in the "Create List" box to save the list as a .csv file that you can open in Excel;
- Open the "Options" window, and select "Use Mean"
- The brightest stars in M12 have a visual magnitude of around 12. Find the brightest star, and set that with a reference value of 12.
- Select about 50 stars and save the list. It will be a ".csv" file, which can be imported into Excel. To help you keep track of the stars you choose, you might find it useful to print out a finder chart in black and white of the images.
- Do the same procedure for the B image. The "quick and dirty" way to set the reference magnitude is to take an average of the B-V values from the spread sheet in part 1, and calculate a reference B magnitude to which to calibrate.
- Open the saved .csv files in Excel, calculate the B-V values, and make a graph of V on the y-axis, and B-V on the x-axis. Treat this as you did the pre-determined B, V, and B-V values in part (1), and calculate the age at the turnoff point.
For an in-depth, 32-page activity on this cluster from the European Space Agency,
go to their ESA Educational Exercises website.