Thanks to Prof. Don Marolf for requesting this demonstration
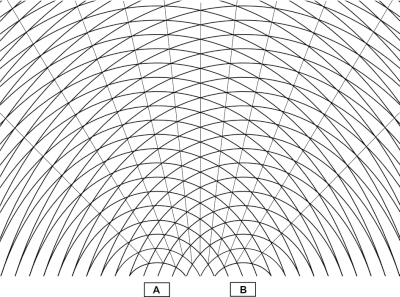
The function generator near the center of the table (a PASCO model PI-9587A) drives the speaker sitting to its right in the photograph. The second function generator (a Hewlett-Packard model HP3310B), sitting to the left of the first, drives the speaker at left. The output of each generator goes both to its respective speaker and to one channel of the oscilloscope at right. The trigger output of the PASCO generator is connected to the external trigger input of the H-P generator, which has a control that allows you to adjust the phase of its output waveform with respect to the trigger input. (The transformer sitting in front of the function generator is to match the (50-ohm) impedance of its output to that of the speaker (8 ohms).) Once you have adjusted the output of the two function generators to the same frequency, this arrangement allows you to control the relative phase of the speaker outputs by anywhere from zero degrees to approximately 140 degrees. (It is not necessary to show the oscilloscope traces to the class, though you can do so if you wish. The scope provides a monitor so that you can see the phase difference between the two waves while you are doing the demonstration. It also allows you to be sure that both waveforms are of the same frequency and amplitude, and that the two are locked at a particular phase.) The speaker at left is connected via a long cable, which allows you to set it some distance from the other speaker. With the setup shown, you can place the left-hand speaker at the left end of the main demonstration table, and the rolling table a few feet to the right of the main table, which gives a speaker separation of approximately four meters. (You will probably wish, however, to use a separation close to the wavelength of the sound. A tone with a frequency of 330 Hz has a wavelength of about one meter.) With this arrangement you can project two sound waves towards the audience, and thus set up an interference pattern. When the two waves are in phase, this pattern is symmetrical with respect to the speakers, and, with appropriate choice of wavelength, the lines of nodes and antinodes are spaced so that students can hear, by moving their heads, the difference in sound level between an area that corresponds to a node, and one that corresponds to an antinode. When you introduce a phase difference (by delaying the wave from the H-P generator relative to that from the PASCO generator), the pattern of nodes and antinodes shifts, so that a student who was sitting in a node may now be sitting in an antinode, or vice versa, or a node or antinode is now closer to the student (on one side or the other) than before. The diagrams below illustrate this phenomenon:
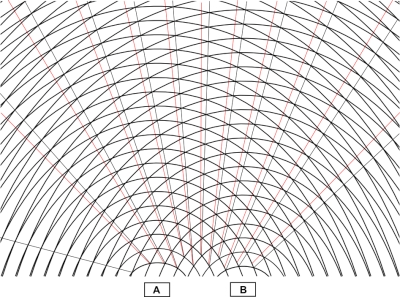
The drawing at left shows the two waves in phase. Wherever the wavefronts meet, their superpostition produces an antinode. The pattern formed by these antinodes is shown in the drawing by lines that connect them. Beween these lines are regions where the interference between the waves is destructive, i.e., where nodes occur. The diagram at right shows the wave from speaker B delayed by 90 degrees with respect to the one from speaker A. The red lines show the original positions of the antinodes when the waves were in phase. The black lines show their new positions.