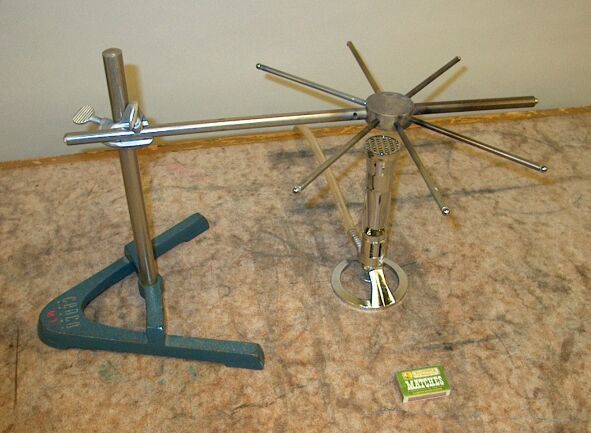
Eight metal rods protrude from a metal hub. One rod is used to support the hub above a Méker burner. The other rods are nickel, nickel silver, iron (two rods of different diameter), copper, brass and aluminum. (Nickel silver, perhaps best known as “German silver,” is a family of alloys that contain copper, nickel and zinc, sometimes with small amounts of other metals such as lead, manganese and iron). All rods are 1/4″ in diameter and about 5-9/16″ long, except for one iron rod, which is twice the diameter of the other rods (1/2″, but the same length). These are labeled on the hub, respectively, “NI,” “NIAG,” “FE,” “FE,” “CU,” “BR,” and “AL.” Stuck to the ends of the rods by means of wax are small steel balls. When you place the lighted burner beneath the hub, the rods conduct the heat away from the hub until their far ends become hot enough to melt the wax that is holding the balls. Exactly how long this takes depends on the height of the hub above the burner, and on the size of the flame, but typical times are (in minutes and seconds): Cu, 1:06; Al, 1:19; brass, 2:17; Fe (1/2″), 3:48; Fe (1/4″), 4:09; NiAg, 4:50 and Ni, 10:03.
If we take a piece of material whose cross-sectional area is A and thickness is Δx, with a temperature difference between its faces, we find that heat flows between the two faces, in a direction perpendicular to the faces. The time rate of heat flow, ΔQ/Δt, for small ΔT and small Δx, is proportional to A(ΔT/Δx). In the limit of infinitesimal thickness dx, with temperature difference dT, this becomes H = -kA(dT/dx), where H (= dQ/dt) is the time rate of heat flow through the area A, dT/dx is the temperature gradient across the material, and k, the proportionality constant, is the thermal conductivity of the material. People often use the Greek letter κ to represent this constant. The minus sign is there because heat flows from the side at higher temperature to the one at lower temperature.
We now take a rod of material of length L and (constant) cross-sectional area A in which heat flow has reached a steady state. In this situation, the temperature at each point in the rod does not vary with time, so H is the same at all cross-sections of the rod. This means, by the equation above, that dT/dx is also constant, and the temperature difference along the rod is linear with distance and is -dT/dx = (T2-T1)/L. Thus, H = kA(T2-T1)/L.
In this demonstration, we do not maintain a constant temperature difference between the ends of the rods, and the situation is perhaps complicated by heat loss through radiation, but it does provide a graphic illustration of how a material’s thermal conductivity affects the rate of heat transfer through it.
Heat flows in a direction perpendicular to the faces of our piece of material (or to the ends of the rod), and opposite to that of the temperature gradient. This flow may thus be expressed as a vector, and we may also generalize it to blocks of material shaped differently from the slab we started with. To do this, we first define the vector h, whose magnitude at a point is the amount of thermal energy per time, and per unit surface area, that passes through an infinitesimal surface element situated at right angles to the direction of flow. Its direction is the direction of the flow. If we call the energy flow per time, per area ΔJ, and the surface element ΔA, then h = (ΔJ/ΔA)ef, where ef is a unit vector in the direction of flow.
Now we take the slab of material that we started with, but imagine it as a tiny piece of a larger block of material, sitting between and parallel to two isothermal surfaces. (In this case, the equation above, for the rod, becomes J = κA(T2 - T1)/d, where we’ve used κ instead of k for the thermal conductivity, and d is the distance between the surfaces (instead of L for length).) Now, if we take ΔA as the area of our slab, and Δs as the thickness, the heat flow per time is ΔJ = κΔT(ΔA/Δs). We can write this as ΔJ/ΔA = κ(ΔT/Δs). The left side is the magnitude of h, and ΔT/Δs is the temperature gradient. Since it is oriented perpendicular to the isothermal surfaces, it is a maximum, and thus the magnitude of ∇T, and we have h = -κ∇T.
We now turn back to our demonstration. From the times given above, we would rank the various metals according to their thermal conductivities, from greatest to lowest: Cu, Al, brass, Fe, NiAg and Ni. The different times for the two iron rods, of course, arise from their different diameters. The 1/2″-diameter rod conducts more heat per time than the 1/4″-diameter rod because of its larger cross-sectional area.
In this analysis, we have ignored the heat capacity of the metal rods, the amount of heat necessary to raise their temperature by a particular amount. Since one iron rod is twice the diameter of the other, it has four times the cross-sectional area, and thus should conduct heat four times as fast. It also has, however, four times the mass of the other rod, and so requires four times as much heat to raise its temperature by the same amount. These factors thus largely cancel, and it takes almost the same amount of time for the ends of the two rods to reach the melting point of the wax.
From the equations above, we find that the SI units of thermal conductivity, κ, are J/s·m·C°, or W/m·C°. Some typical values, from Goodfellow (a supplier of metals, alloys, polymers, ceramics and glasses for research, home page http://www.goodfellow.com; search for information at this link; once you have found the material, click on the tab labeled “Thermal Properties”) are listed in the table below. Also given are heat capacities, C, in J/g·C°. Except for those for brass and nickel silver, these are from The Engineering Toolbox. The heat capacities for brass and nickel silver (Cu 62/Ni 15/Zn 22) are from Engineers Edge.
The demonstration results above are in rough agreement with most of these values, except for the last two, NiAg and Ni. It could be that our NiAg sample is not of the same composition as the one in the table, and that our nickel sample is not pure. (It is not likely that they are switched, as the nickel rod is attracted by a magnet, but the nickel silver rod is not.) Also, κ can change with temperature, and depending on how greatly it changes for the various materials at the temperatures we use in this demonstration, our results may differ from what we might expect from the tabulated values.
References:
- 1) Resnick, Robert and Halliday, David. Physics, Part One, Third Edition(New York: John Wiley and Sons, 1977), pp. 480-482.
- 2) Feynman, Richard P., Leighton, Robert B. and Sands, Matthew. The Feynman Lectures on Physics, Volume II, Mainly Electromagnetism and Matter (Reading, Massachusetts: Addison-Wesley Publishing Company, 1963) 2-3, 2-8 to 2-9.