 |
 |
 |
 |
Fault Heterogeneities
|
The strength of faults (i.e., their resistance to slip) varies considerably on almost almost every scale. When a propagating rupture encounters some local variation in strength, its shape and speed are affected and it radiates energy away as seismic waves. The extreme heterogeneity of real faults makes it difficult to decipher the ground shaking. As a start, we study the idealized problem of a single, circular high strength region known as a barrier. Figure 1 and this movie show the rupture process on the fault plane for this problem. This is reported in Dunham et al. (2003). 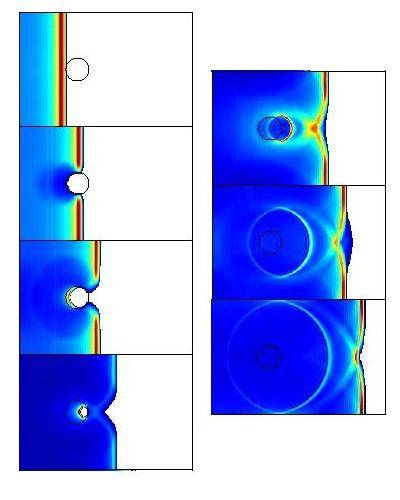
Figure 1: Consecutive snapshots (top to bottom) of the fault plane, showing a rupture breaking through a high strength barrier. The color scale measures slip velocity (warm colors mean faster sliding), and is renormalized in each snapshot. The rupture propagates to the right and is initially delayed by the barrier (which requires four times more energy to break than the surrounding fault). In contrast to what might be expected, the rupture actually shoots forward ahead of where it would have been in the absence of any perturbation! This is clearly shown in the middle image of the right column. Why does the rupture temporarily speed up? The answer lies in understanding the effect of rupture front curvature. As described previously , the region behind the rupture front where the stress is released is the source of elastic waves. These waves diffract off of the moving crack edge. If the crack edge is curved, then the waves become focused.This is illustrated for a simple crack edge geometry in Figures 2 and 3 below. 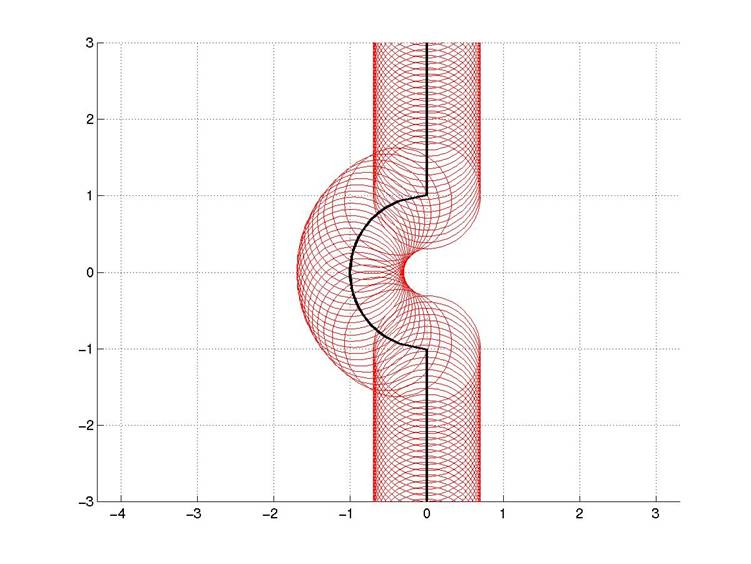
Figure 2: Consider an increment of crack growth when the crack edge is locally concave. Each point behind the crack edge is a source of elastic waves, each of which is represented with a red circle (wave velocity is assumed isotropic for simplicity and only one wave type is shown). Focusing toward the center of the barrier is evident. 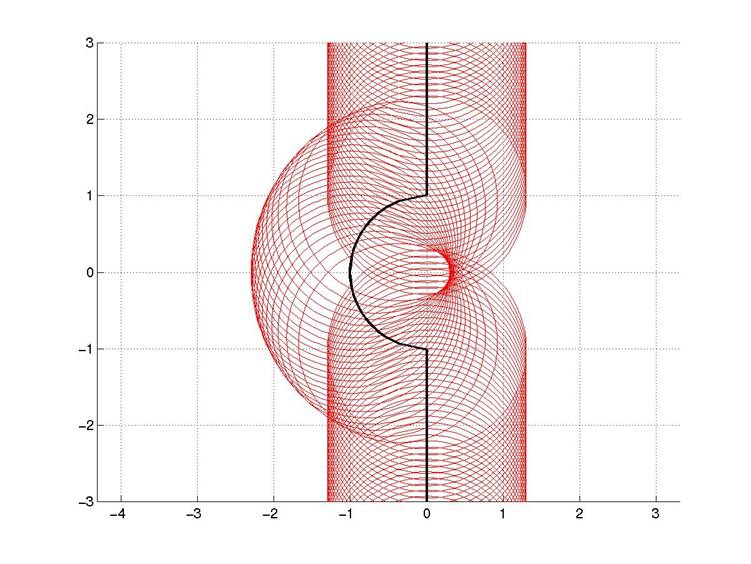
Figure 3: Similar to the above figure, but after the waves have converged in the center of the barrier. The center of the barrier is the point of maximum focusing. The pattern of wavefronts matches that observed in the numerical models of the barrier. Another distinctive feature of the simulation is the set of nearly elliptical slip pulses that radiate from within the barrier. To understand these better, we further idealized the barrier to a point and neglected any diffractions off of the crack edge. This made the problem analytically tractable and we found an exact expression for the transient displacement field anywhere in the surrounding medium or on the fault. This is reported in Dunham (submitted 2004 to J. Mech. Phys. Solids). Questions? E-mail Eric Dunham |