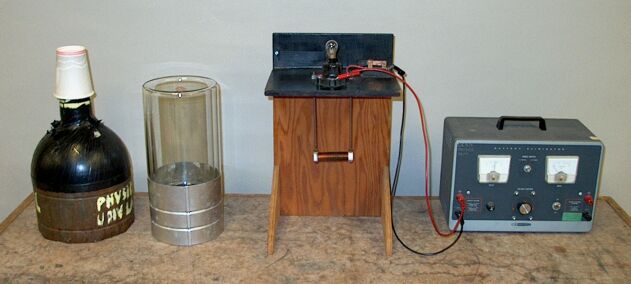
A light bulb (at the top of the apparatus pictured in the middle) and wire-wound resistor (at the center of the apparatus pictured in the middle) are connected in series across a power supply. When you turn on the power supply, the bulb lights dimly. Now lower the resistor into the clear dewar filled with liquid nitrogen. As the resistor cools down, its resistance decreases, and the bulb goes from dim to very bright.
Demonstration 64.15 -- Resistance simulator, illustrates in a rough way how the effects of interactions of conduction electrons with the atoms in the crystal lattice of a conductor give rise to electrical resistance in the conductor. As electrons move through a conductor under the influence of an applied electric field, besides interacting with each other, they are affected by the charges on the atoms in the crystal lattice, which produce a periodic potential through which the electrons move. Imperfections in the lattice, which disrupt this potential, cause scattering of electrons. Lattice vibrations produce a type of wave in the lattice that manifests as phonons, which also scatter electrons. All of these things contribute to the electrical resistance in the conductor, specifically the intrinsic property of the material called its resistivity.
The resistance of a piece of material is a function of its resistivity, its shape and how an electrical potential difference is applied to it. For example, if one has a rectangular bar of material (and it is isotropic, so its resistivity is the same in all directions), the whole bar has the same resistivity, but its overall resistance is greatest if the potential is applied at its ends, intermediate if the potential is applied across its width, and least if the potential is applied across its thickness. Resistivity, and how it and the geometry of a conductor determine overall resistance, are discussed on the page for demonstration 64.12 -- Resistance in different-diameter wires.
Briefly, resistivity is the ratio of the electric field in the conductor and the current per unit cross section, or:
ρ = E/(i/A)
E is in volts per unit length. If we have a piece of material with a voltage V placed across its ends, then
ρ = V/(Li/A),
where L is the length of the piece of material, and A is its cross-sectional area. We assume that the resistivity does not change with the applied voltage – that the material behaves ohmically. From this we also see that the units for ρ are ohm-m. Resistivity is also often quoted in ohm-cm. (This may be easier to see if we rearrange the above to ρ(L/A) = (V/i). ρ(L/A) equals R, the overall resistance in ohms.)
The resistivity of a material is affected by temperature. As the temperature increases, both the number of lattice defects and the number of phonons increase, thus increasing the scattering of electrons moving through the material. Conversely, as the temperature decreases, both of these things decrease, and so does their effect on the motion of electrons through the material. We might then expect that as the temperature increases, the resistivity of a material increases, and as the temperature decreases, the resistivity of the material decreases. Though the situation is more complicated than described here, most metals behave this way. For most (but not all) metals, the resistivity increases with increasing temperature, and it decreases with decreasing temperature. For semiconductors and other nonmetals, the resistivity decreases with increasing temperature. A variety of materials, including mercury and some other metals and alloys, and some metal-oxide ceramics, exhibit a behavior in which as the temperature drops, their resistivity decreases until at a particular temperature it falls abruptly to zero. The material becomes superconductive (see demonstration 64.27 -- Measure volatage drop in superconductor).
For most metals, the relationship between resistivity and temperature is a smooth curve, for which over a sufficiently narrow temperature range one can use the straight line that most closely fits the curve over that range. (This range can be anywhere from 100 to a few hundred degrees C.) The slope of this line, α, is called the temperature coefficient of resistivity. Strictly speaking, α is defined by
α = (1/ρ)(dρ/dT),
but as noted above, it varies somewhat with temperature. This variation is small enough that for most practical purposes, using the linear approximation described above gives adequate results. In this case α is really the average value over the temperature range over which one is measuring. The resistivity becomes
ρ = ρ0[1 + α(T - T0)],
where ρ0 is the resistivity at reference temperature T0, the bottom of the temperature range being used, and T is the temperature for which we wish to know the resistivity. We see that as the temperature increases, so does the resistivity, and as the temperature decreases to T0, ρ goes to ρ0.
Most sources quote values for both ρ and α for materials at nor near room temperature (20 °C). You can see a table of these values for a variety of materials at this link. Note the negative temperature coefficients for carbon, germanium and silicon. Constantan and manganin, alloys specially designed so that their resistivity does not change with temperature, have extremely low temperature coefficients (~10 ppm/°C; see the information at this link [PDF] and at this link [PDF].)
This variation of resistivity with temperature, both in metals and in semiconductors, is extremely useful in thermometry. A length of wire, suitably protected, and connected to a device that measures its resistance, can be used as a thermometer. The platinum resistance thermometer, which uses a coil of platinum wire as its sensing element, is perhaps the most common example of this type of thermometer. A thermistor is a piece of semiconductor material whose resistance changes with temperature, which is also widely used as the sensing element in thermometers.
References:
- 1) Halliday, David and Resnik, Robert. Physics, Part II, Third Edition (New York: John Wiley & Sons, Inc., 1978), pp. 678-683.
- 2) Young, Hugh D. University Physics, Eighth Edition (Reading, Massachusetts: Addison-Wesley Publishing Company, Inc., 1992), pp. 717-719.
- 3) Sears, Francis Weston and Zemansky, Mark W. College Physics, Third Edition (Reading Massachusetts: Addison-Wesley Publishing Company, Inc., 1960), pp. 544-547.
- 4) Eisberg, Robert and Resnik, Rober. Quantum Physics of Atoms, Molecules, Solids, Nuclei, and Particles (New York: John Wiley & Sons, Inc., 1974), pp. 490-533.
- 5) Sears, Francis Weston and Zemansky, Mark W. University Physics, Third Edition - Part One: Mechanics, Heat and Sound (Reading, Massachusetts: Addison-Wesley Publishing Company, Inc., 1963), p.338.