We present a simple lattice model for evolution.
A collection of lattices are subjected to similar rules as in biological
evolution. That is, in each generation, they multiply to produce
greater number of offsprings with random mutations; then the offsprings
have to compete for the limited space to survive, which introduce the element
of selection. Random mutation and natural selection lead to highly
efficient design of the lattice sturcture. Because of the transparency
of the lattices and the ease of their manipulation, we have a clear visualizaton
of the genotype and phenotype, and can study in detail their evolution
and their interation. Also we can ask such questions as the effects
of different mutation rates, the structures of the resulting family tree,
etc.
When constructing such a model, even with only minimum
structures, we need to quantify some aspects of the evolution process.
One important aspect is the time scale involved. Our treatment of
fitness for these lattice organisms focuses on the interaction between
three phenomena and the corresponding time scales: 1) the time scale of
large-scale environmental perturbations, from frequently changing seasonal
weather, to climate variations, to rare events such as meteor impacts;
2) the time scale on which a species adapts; 3) the time scale for selection
based on competition among different organisms. The resulting model exhibits
a surprisingly large number of qualitative features which agree with observations,
including the emergence of hypersensitivity to rare disturbances which
arises for organisms that adapt rapidly to more common events.
We have aimed for the simplest possible model that
captures these key features. Our model consists of a population of organisms,
each of which is modeled as a 16x16 square lattice. We define an
upper bound of 1000 on the total population S, so that competition
between organisms is associated with competition for space in a community
of bounded size. Each site on each lattice is either occupied or
vacant. Contiguous nearest neighbor occupied sites define connected clusters.
The effect of environmental perturbations is modeled by ``sparks'', chosen
from a probability distribution P(i,j), which impact each lattice at the
same site (i,j). If (i,j) is vacant then nothing happens. However, if (i,j)
is occupied the entire connected cluster of occupied sites containing the
original sparked (i,j) site ``burns'' and is thus lost. For our numerical
simulations we take P(i,j) as exp(-(i+j)/L), where L is1/6 of the lattice
size, although our basic conclusions and the features of the resulting
design (including sensitivity to changes in the P(i,j)) do not depend on
the specific form of the nominal P(i,j).
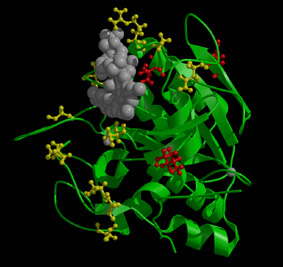
The fitness, or yield of a lattice in any generation
is the remaining density computed from one spark selected from P(i,j) and
applied to this lattice. Computing yield is a stochastic process:
a single spark impacts a single lattice, which mimics fitness evaluated
on a noisy landscape with a short time horizon, primarily sampling the
most common events. Highly Optimized Tolerance (HOT) arises when
the long-term fitness is maximized using some optimization strategy. Any
deliberate design tradeoff between maximizing density and minimizing loss
leads to non-generic, structured states with yields well in excess of the
corresponding randomly generated configurations. The price paid for the
high yields is that the resulting HOT configurations can be extremely sensitive
to changes in the P(i,j) away from what was assumed in the design. In our
model ``design'' is explored by random mutation and selection on yield.
(1) Independent niches
We consider a system of organism competing in one
niche that has a maximum population size of 1000. We start with 1000
random lattices. For each generation a parent lattice produces two
offsprings, each with a finite probability of mutation. Here mutation
corresponds to inverting the occupation of a site. A site has a certain
probability to mutate if itself or one of its neighbor is occupied.
A lattice's death rate is min(0, 1- 2Y^2), so for a random lattice, its
probability of death is about 1/2 and because there are two offsprings
to a parent, the population size is maintained. Each resulting generation
of offspring is then subject to natural selection based on fitness.
When a lattice is considered ``dead'' it is automatically discarded, along
with the lowest overall performers until the total size
S
in a niche
is S<=1000.
(a) Initial transient
The 1000 lattices at the start all have different
genotypes, i.e. the 1 or 0 digital code, 1 for occupied sites and 0 for
vacant. The process of initial competition reduces the diversity.
Here we measure the diversity with spread of the genotypes: the average
distance between an individual and the average of the collection.
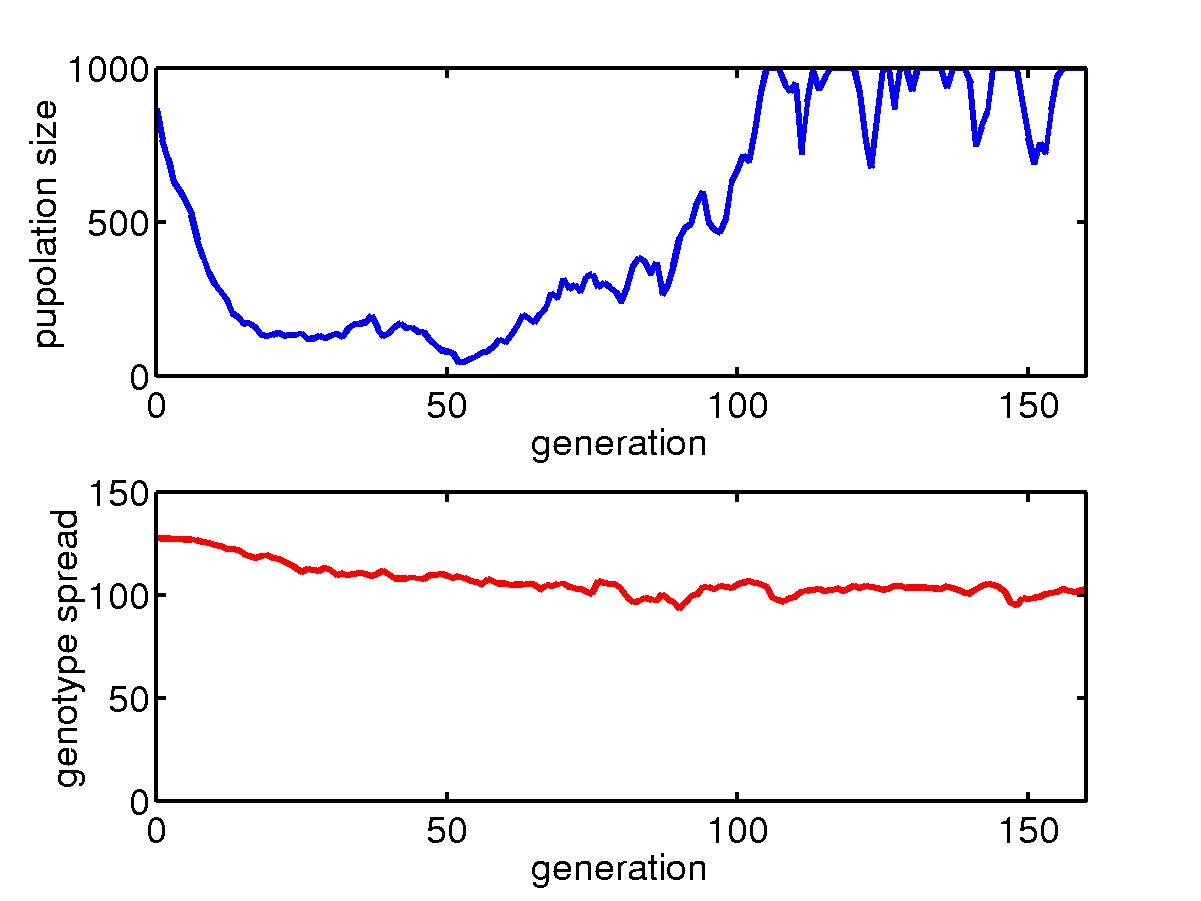
Below is for the initial transient process.
The total population size in the niche generally goes down initially when
some better configured organisms gradually assert themselves. Then
the population size goes back up till it reaches the limit of 1000.
The spread of genotype in a niche, also goes down as the diversity decreases.
However, the minimum spread is somehow connected to the mutation rate,
and we see when the mutation rate is low, this spread can go to very small
value. Also shown are the configurations of some individuals and
the average configuration in the niche.
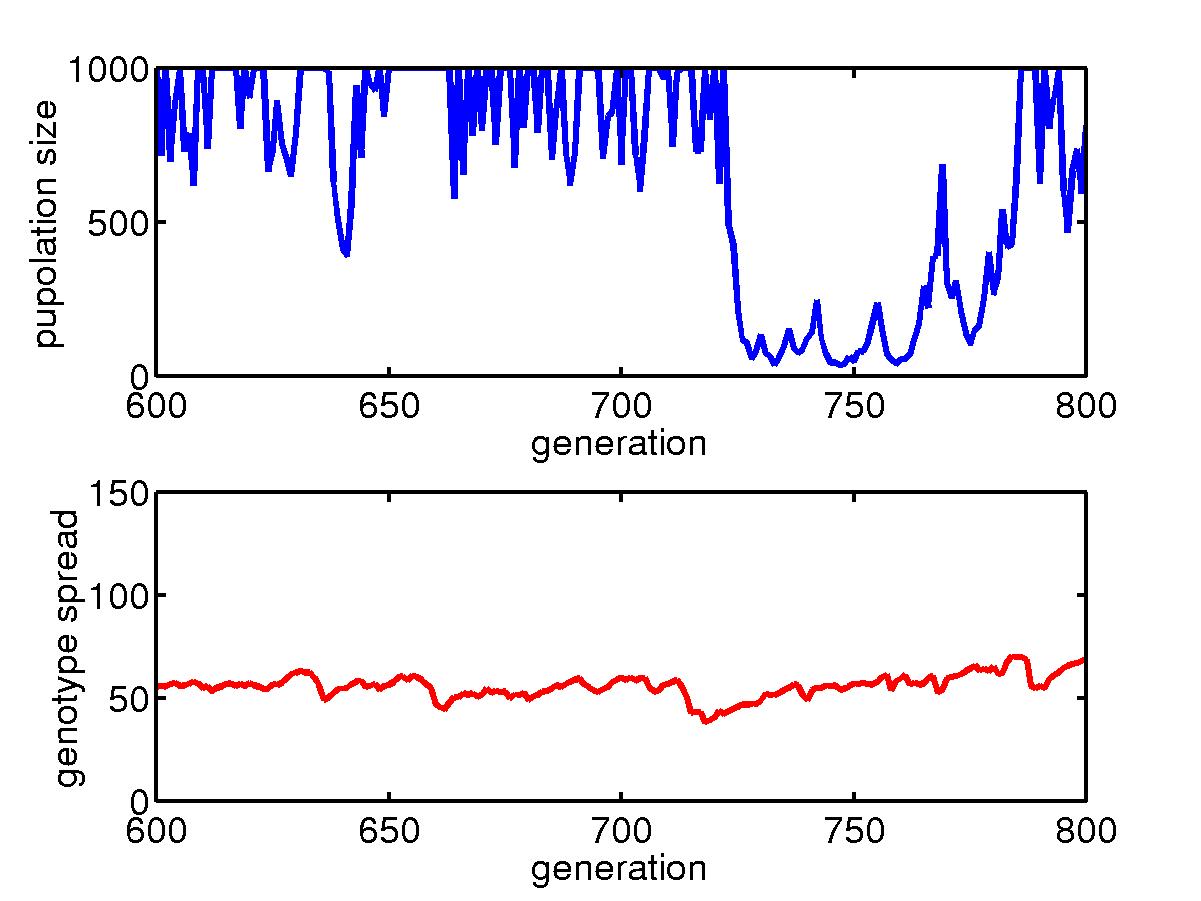
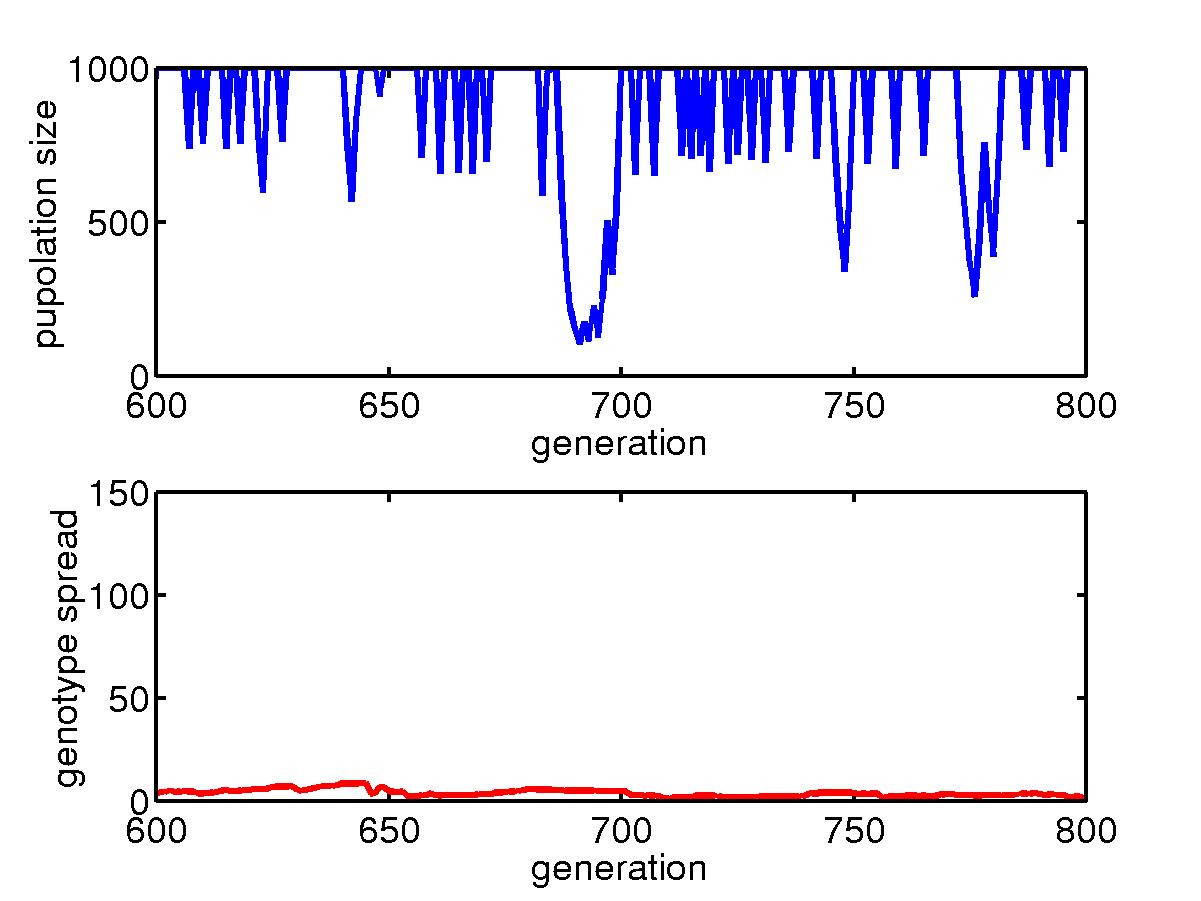
(b) Steady state for a uniform niche
When the niche is subject to uniform hits,
the individuals finally adopt some barriers to separate the lattice into
small pieces and so to reduce the damage from a hit. The typical
configurations are shown above. In the steady state, there are still
fluctuations in the population sizes, as shown in the plots. But
for a uniform niche, the population generally survive for a long period
of time.
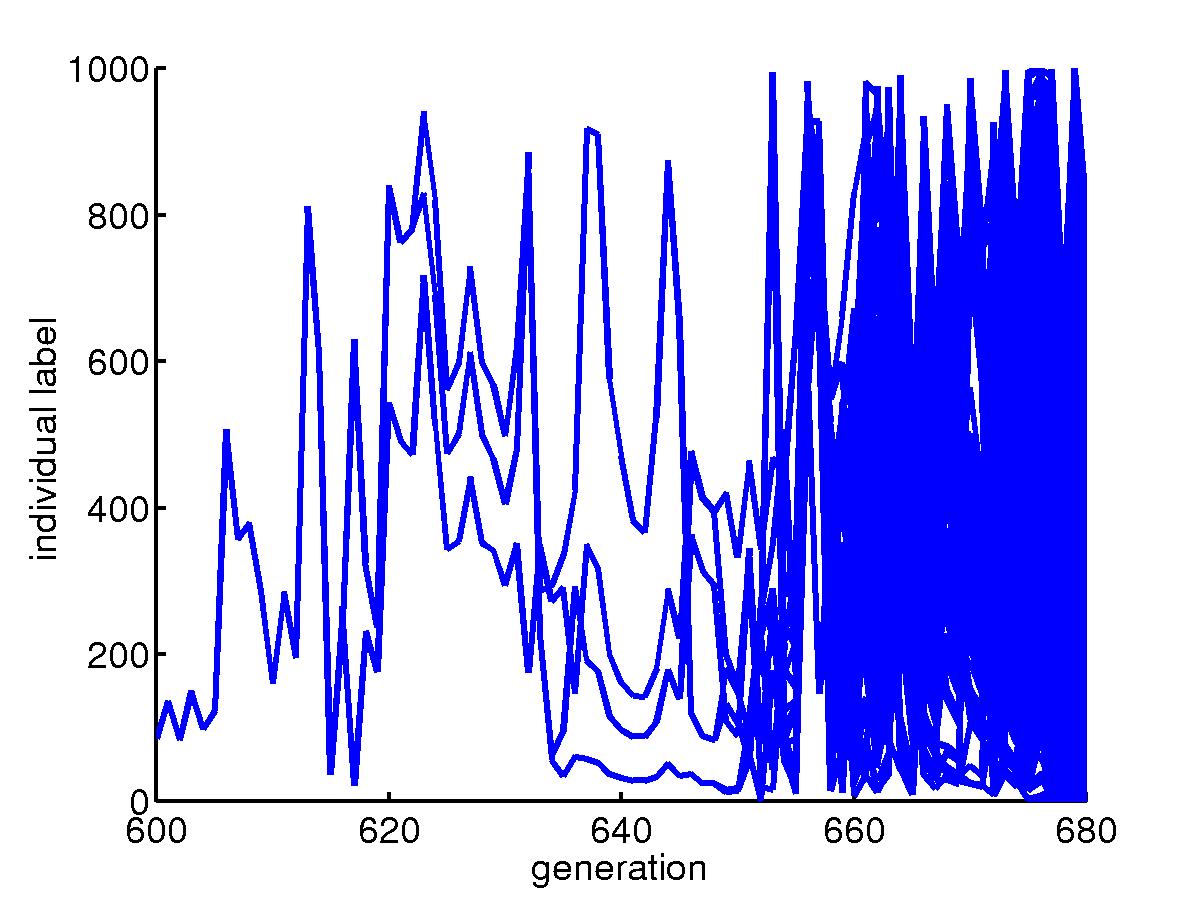
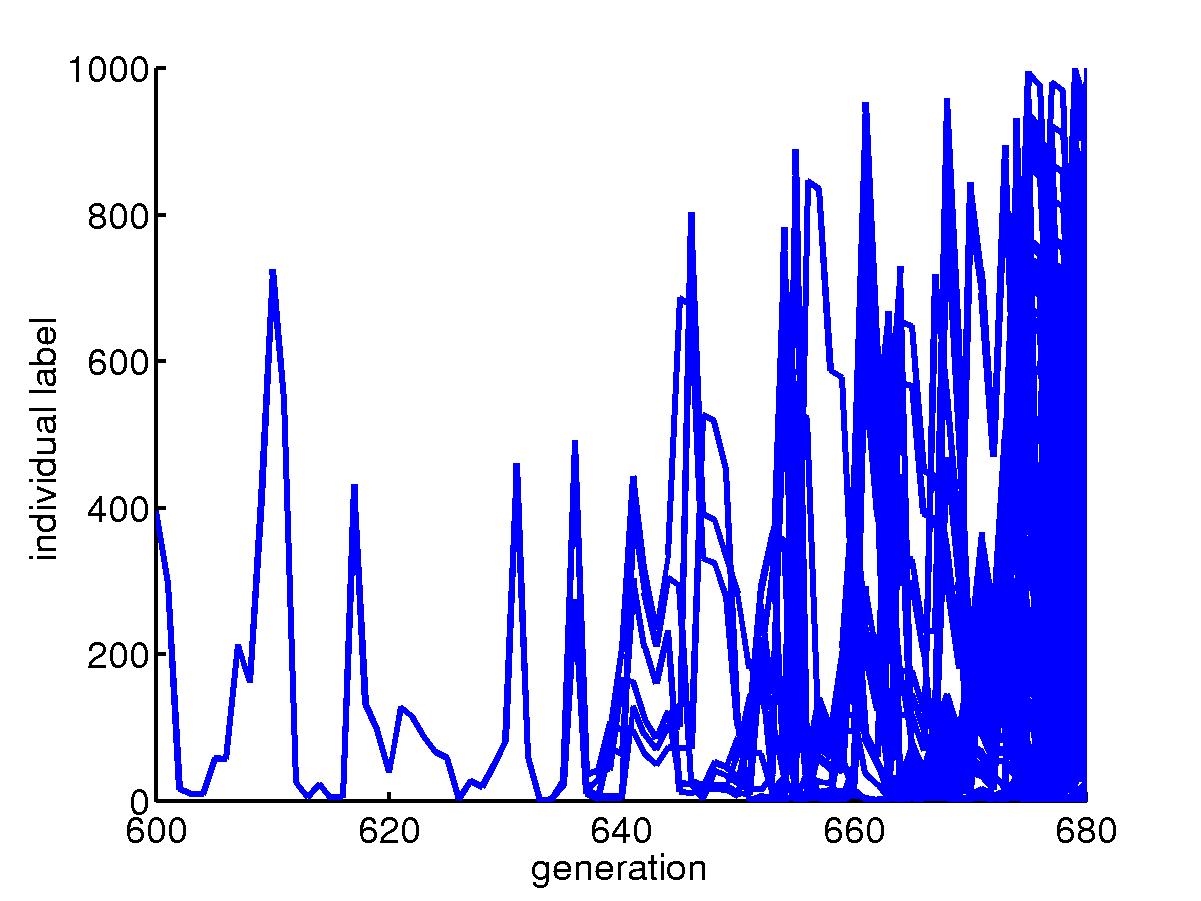
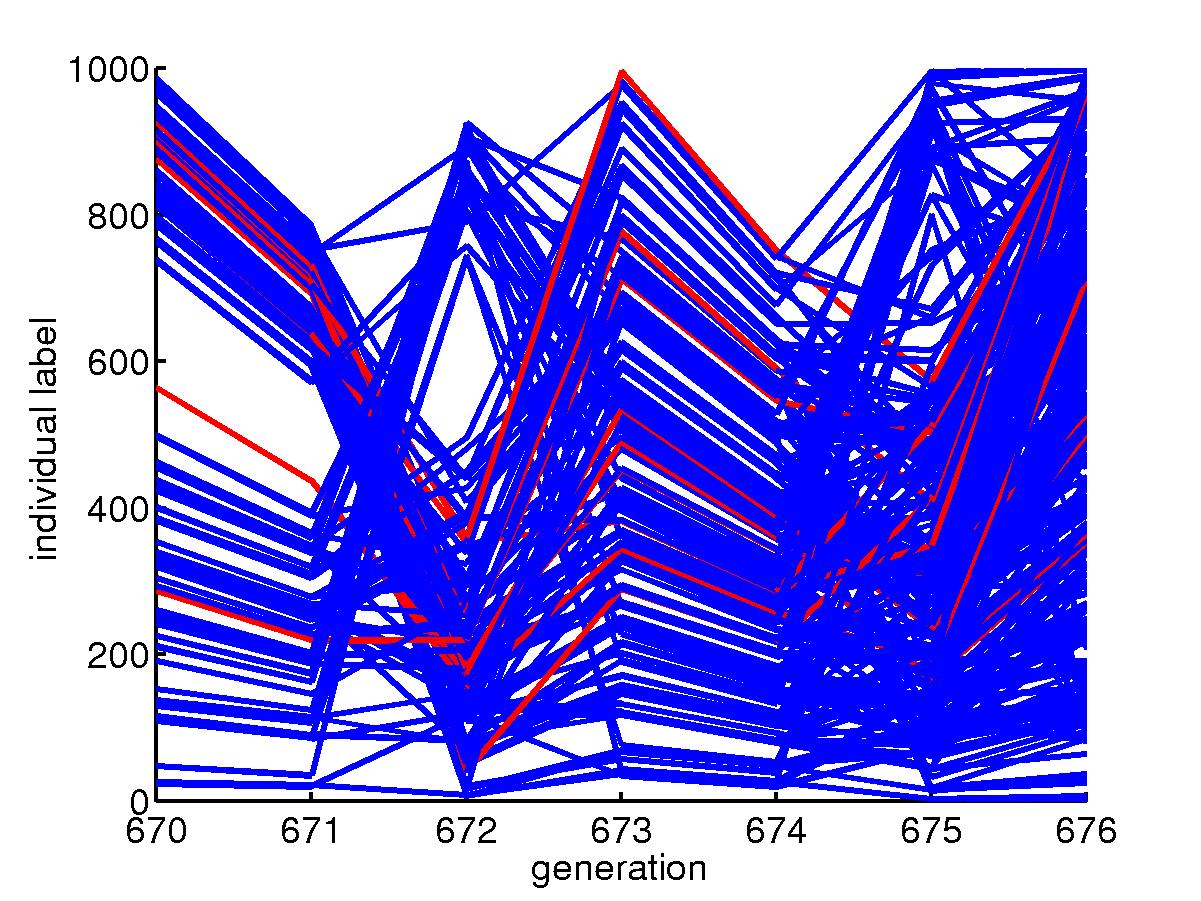
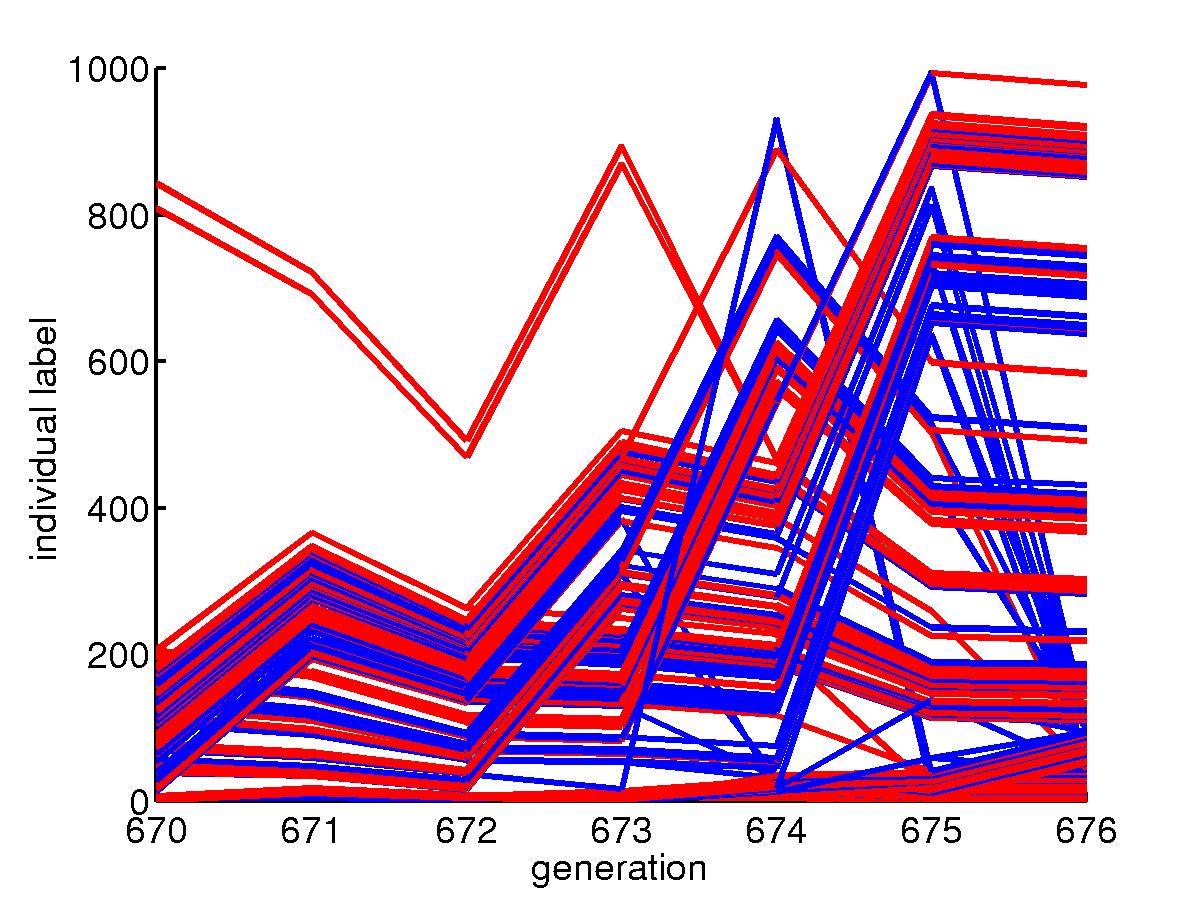
(c) Family tree
The evolution of genotype can be traced by
looking at the family tree. A version of it can be obtained by looking
at the alive individuals at a certain time and trace back their parentage.
A common ancestor is usually found.
(c) Skewed niche
When the niche is subject to hits with a probability
concentrated in the upper left corner and exponentially decaying towards
the lower right corner, the individuals develop barriers close to the upper
left corner to defend against the most often hits and lose barriers at
the lower right corner. However, when a rare event happens, the lower
right corner suffer a hit, which causes the whole population goes extinct.
skewed niche
|
fast mutation rate
|
slow mutation rate
|
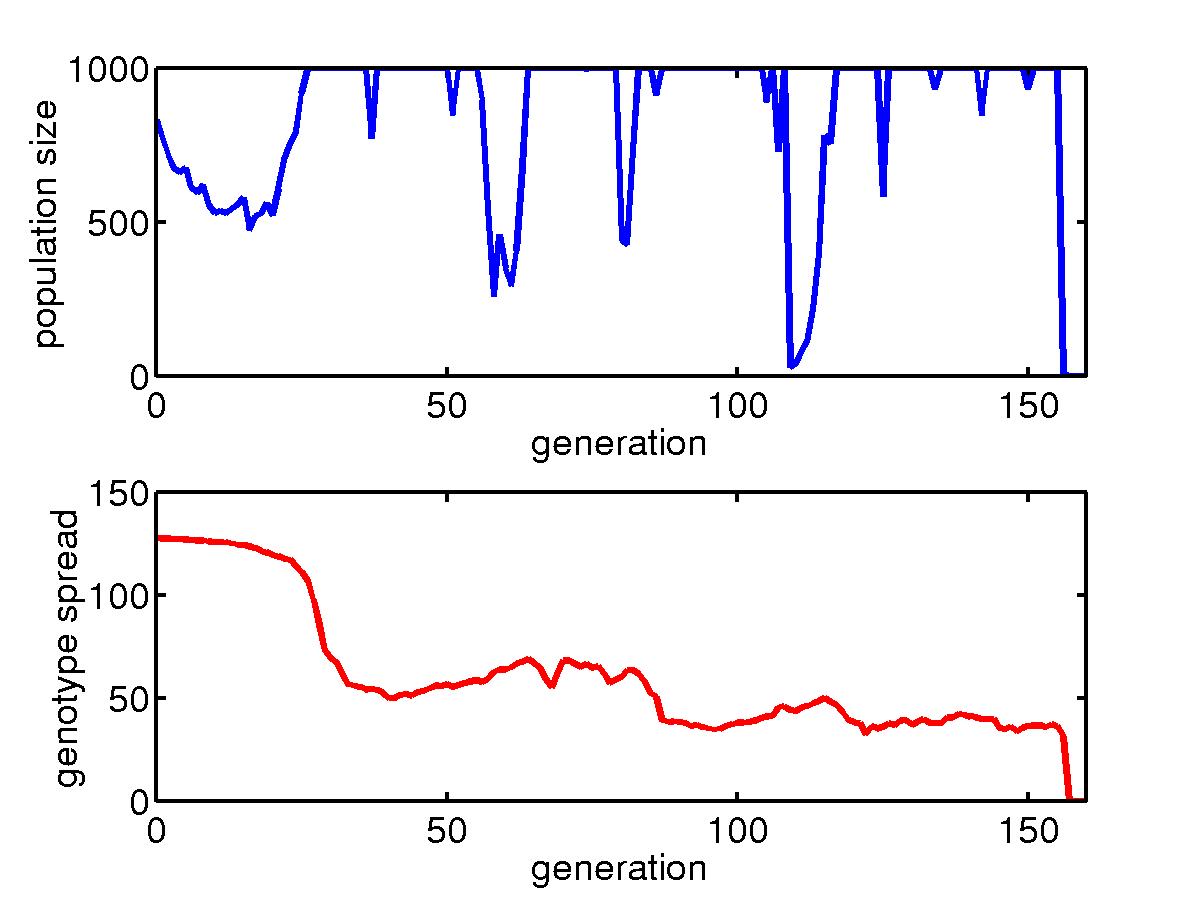
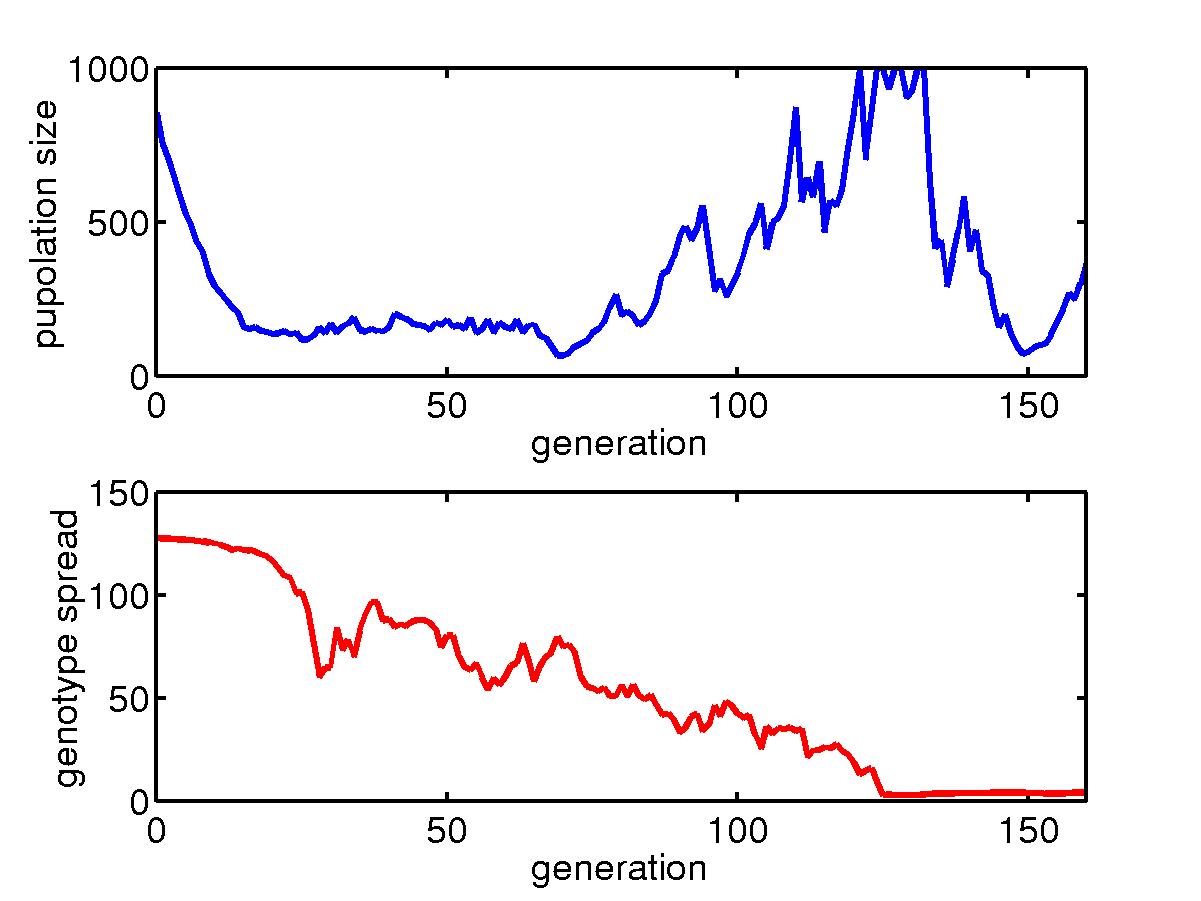
The initial transient for a collection of organisms with fast mutation
rate in a niche under skewed hits where most hits are concentrated around
the upper left corner. For most hits, only barriers near the upper
left corner are needed and so the big lower right region is unprotected.
Once a rare event happens, a big portion of the population die and after
about 160 generations, the species goes extinct. |
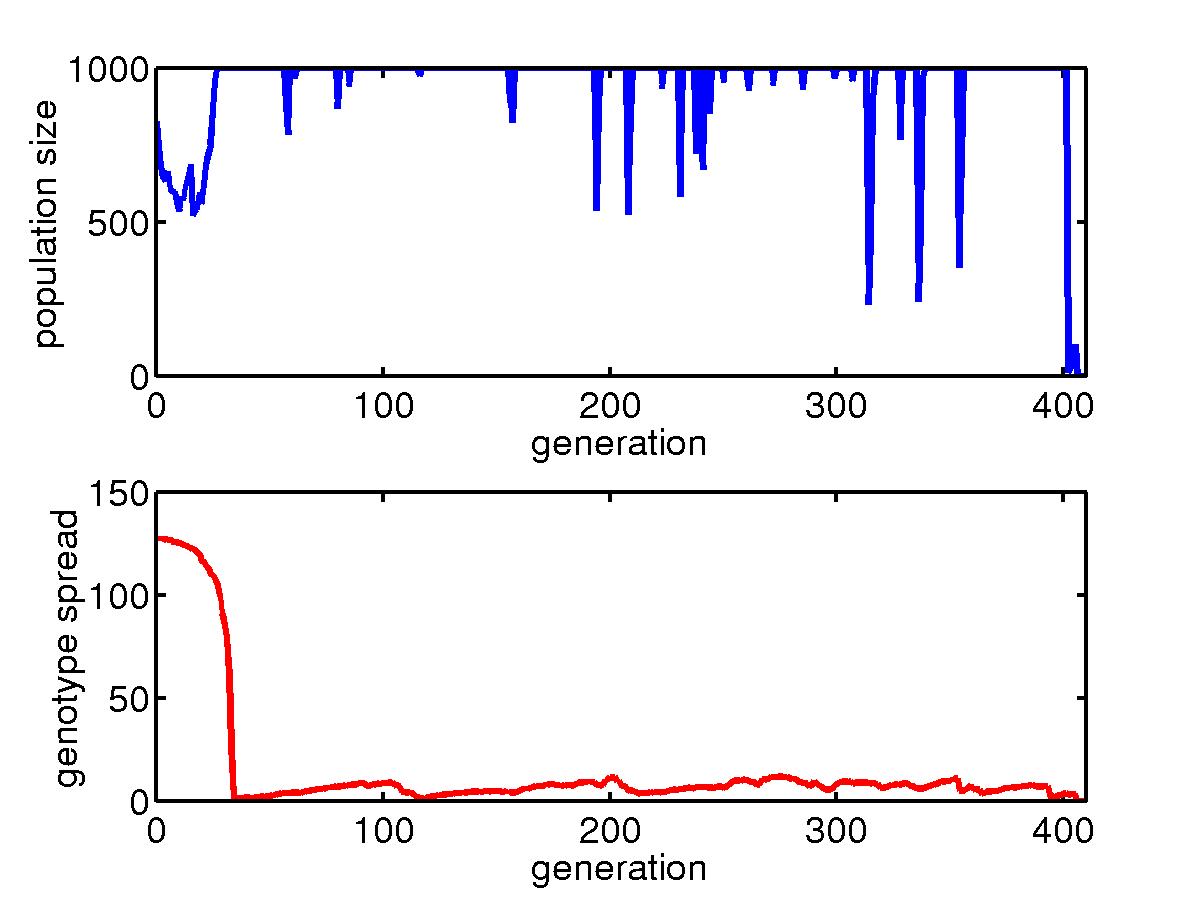
Similar story but for slow mutation rate. Extinction happens after
400 generations.
|
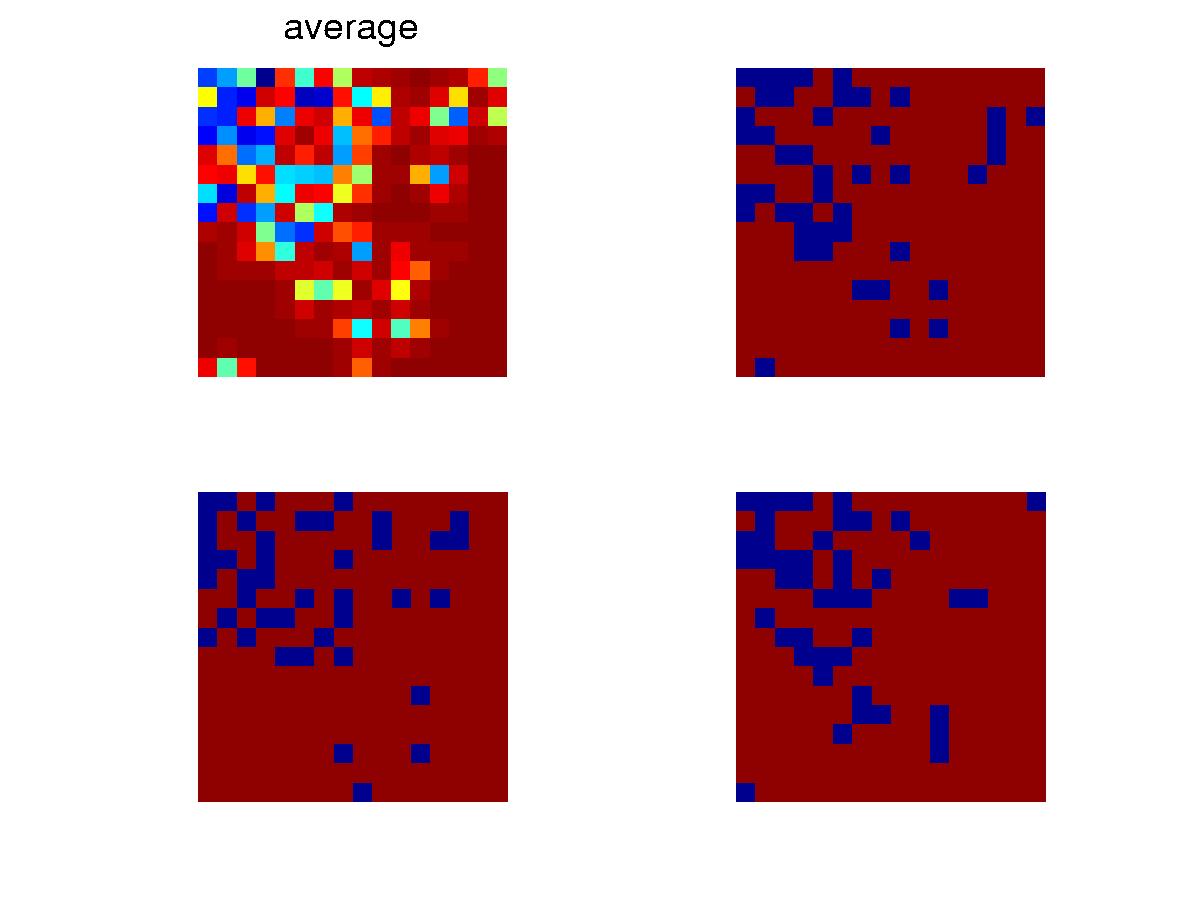
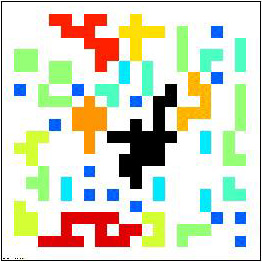
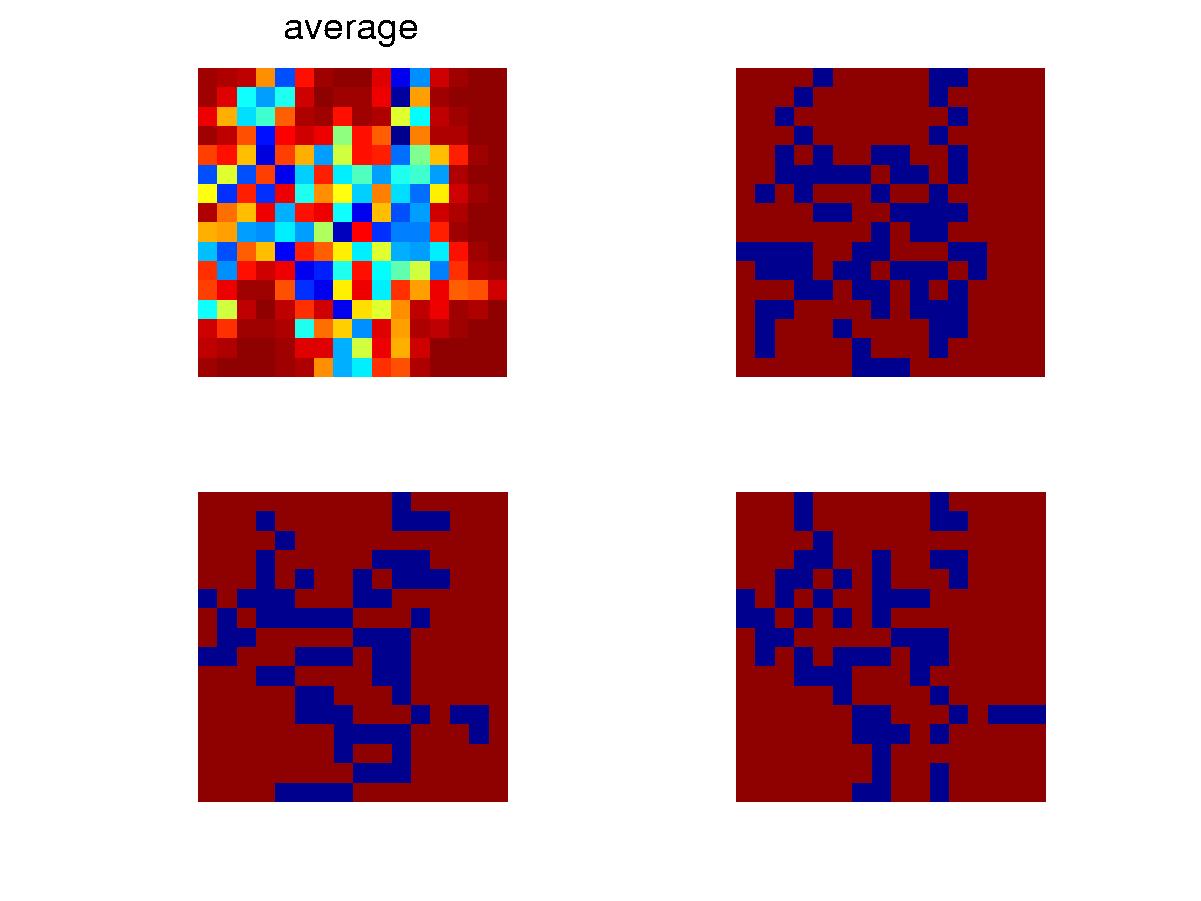
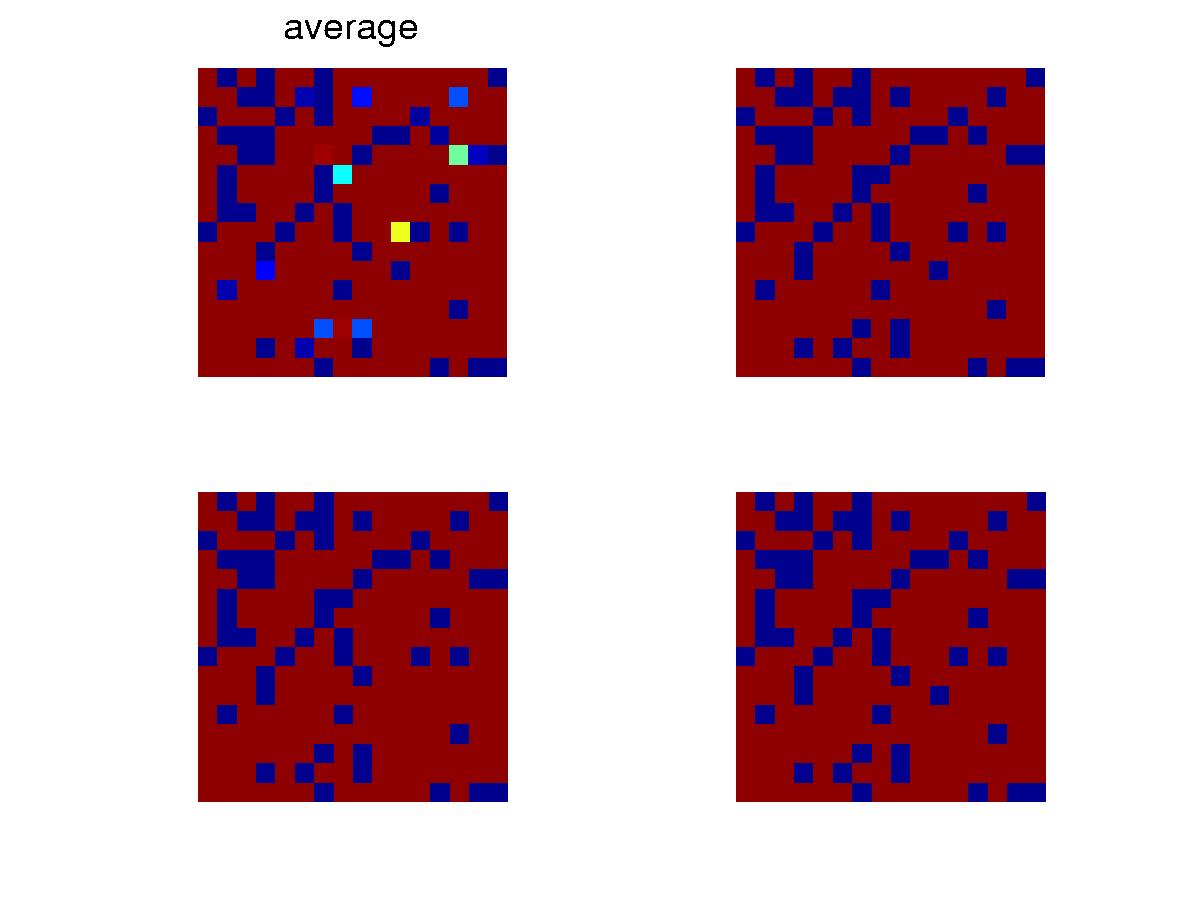
Snapshots at certain time after the initial transient. Blue is
for void and red, ocuppied. The upper left one is for the average
configuration of the whole collection. Different colors are due to
spread caused by mutation, as seen in the different configurations of the
three individuals. |
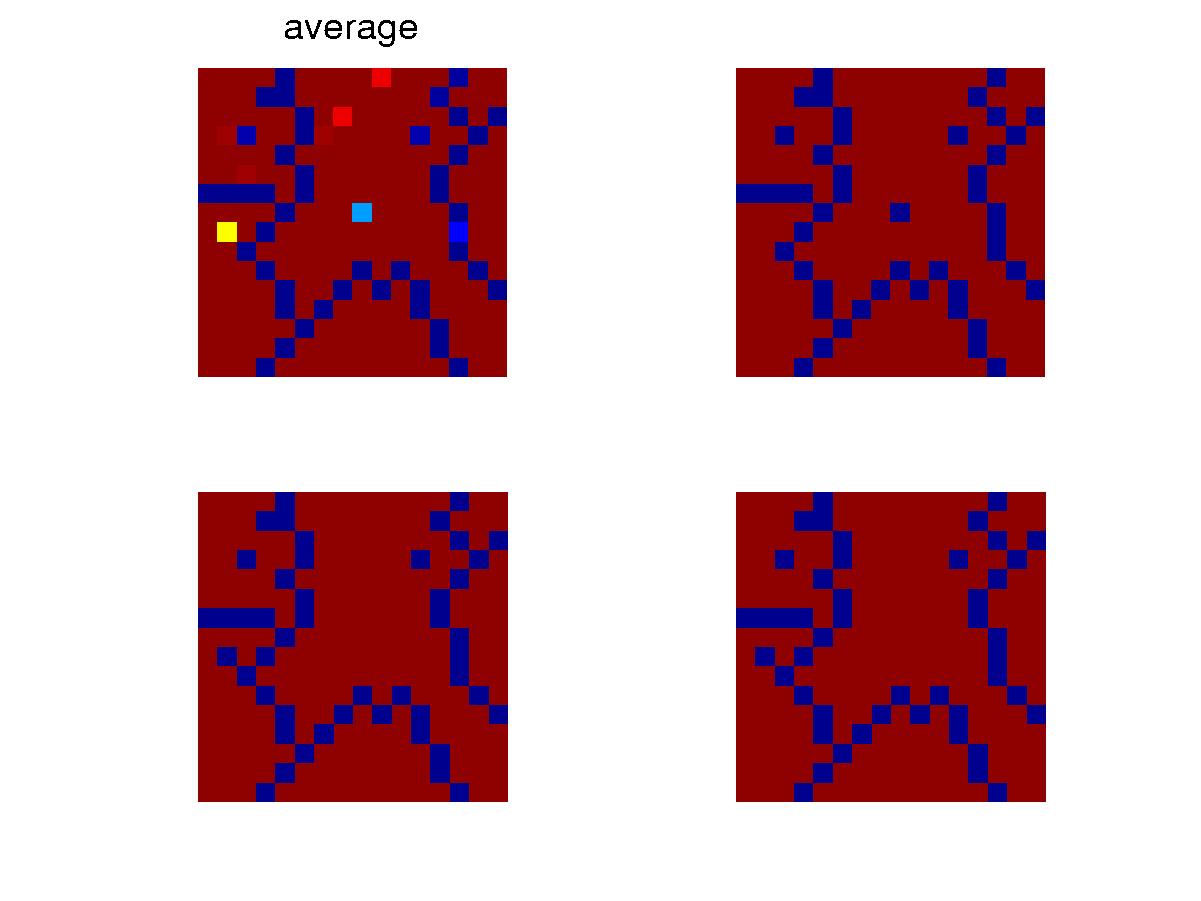
Snapshots at certain time after the initial transient. Blue is
for void and red, ocuppied. The upper left one is for the average
configuration of the whole collection. Because mutation rate is low,
the individuals have almost the same configuration. |
(2) Niches with mutation into each other
Next, we consider the case when the
individuals in a niche have certain probability of mutating into the other
niche.
(3) For species with different mutation rates
We study the effects of different mutation rates
next. There are two species in the two niches, one with a much higher
mutation rate than the other. Similiar as in (2), individuals have
some small probability of jumping between the niches; also, there is a
small probability that a individual can change its mutation rate.
Generally speaking, fast mutators are much better at adapting to new environments
by developing new structures and after such structures are developed, slow
mutators are much better at keeping them till next big change in the environments.
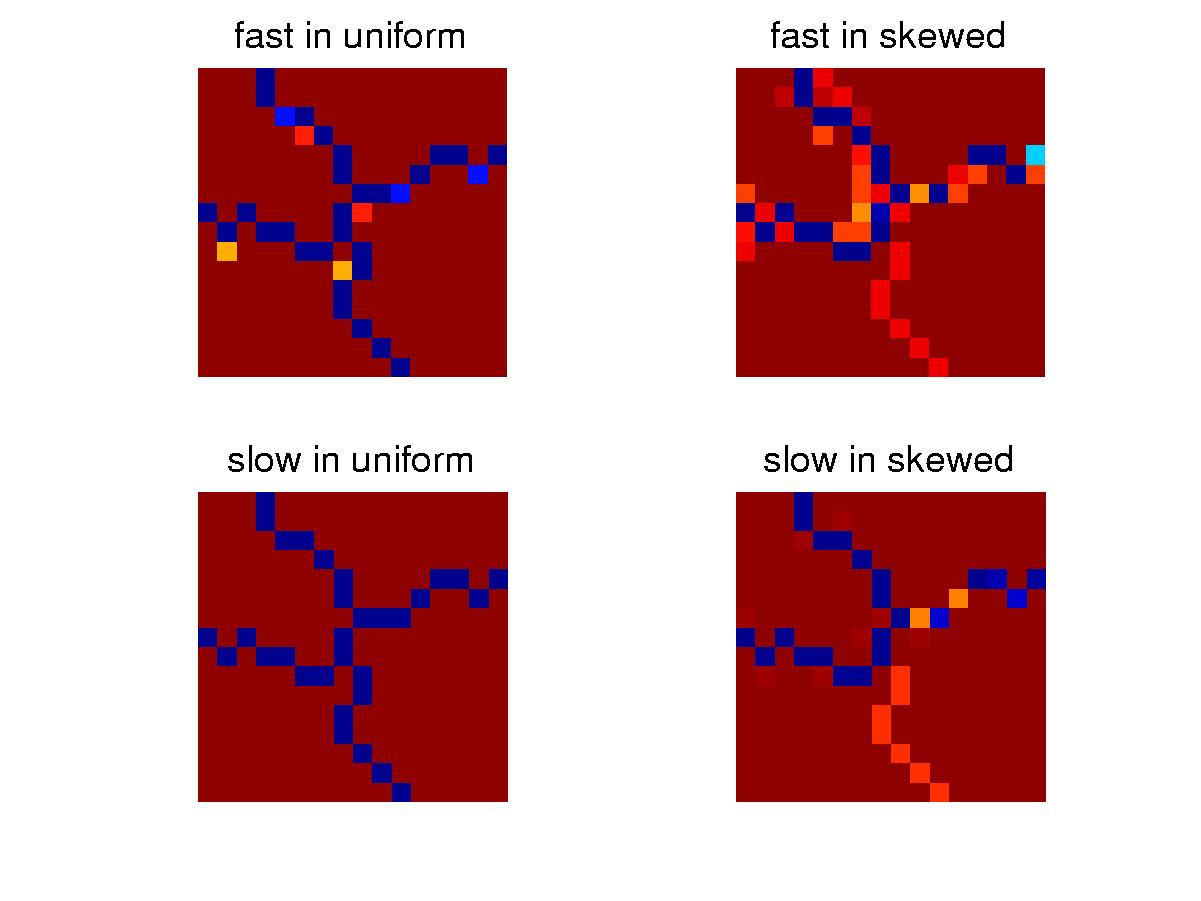
Above is the average configuration of the species
in the two niches. In the uniform niche, barriers of a big cross
are formed and they are very stable. Such barriers are not needed
in the skewed niche, in which fast mutators are quick in losing unnecessary
barriers and pass on the new configuration to slow mutators who take over
the niche. However, when a rare event happens and the lower right
corner, the population in the skewed niche is likely to go extinct.
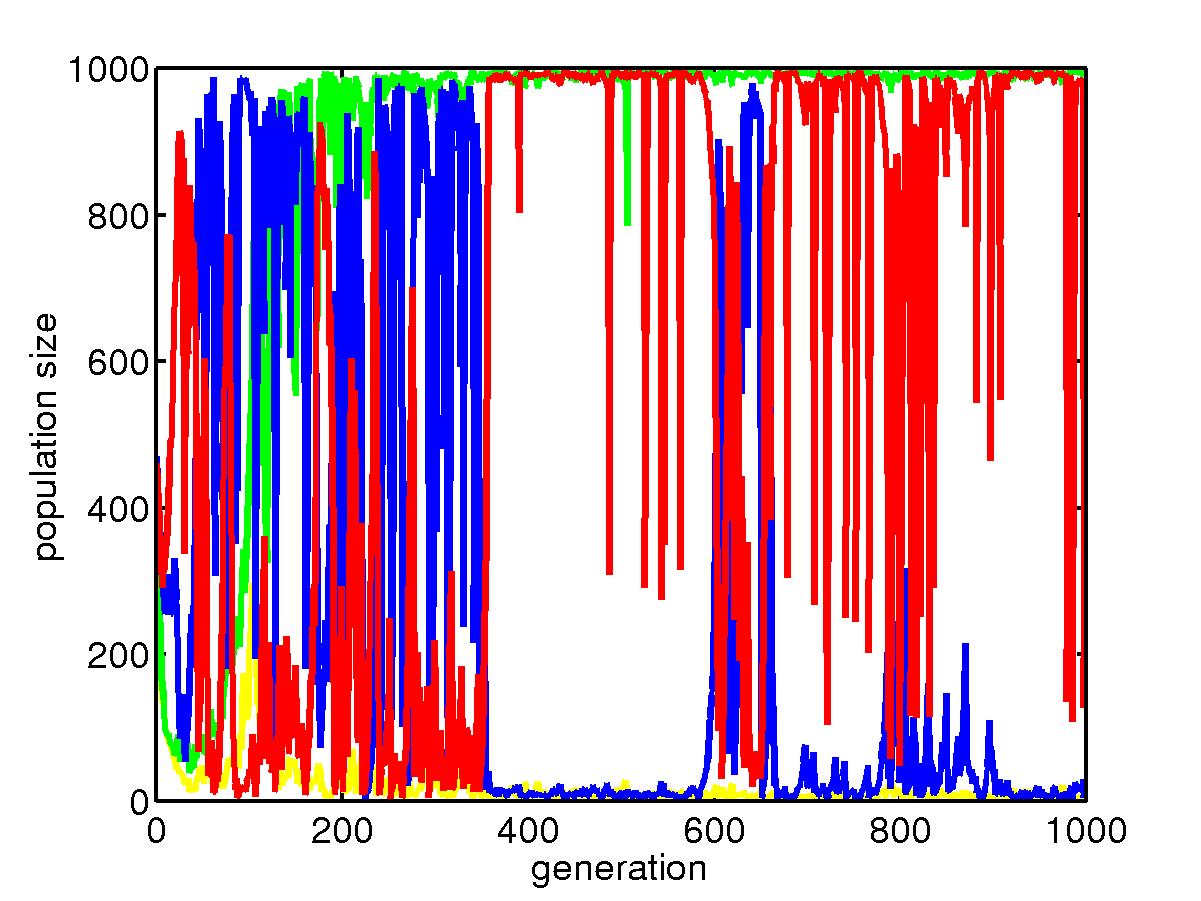
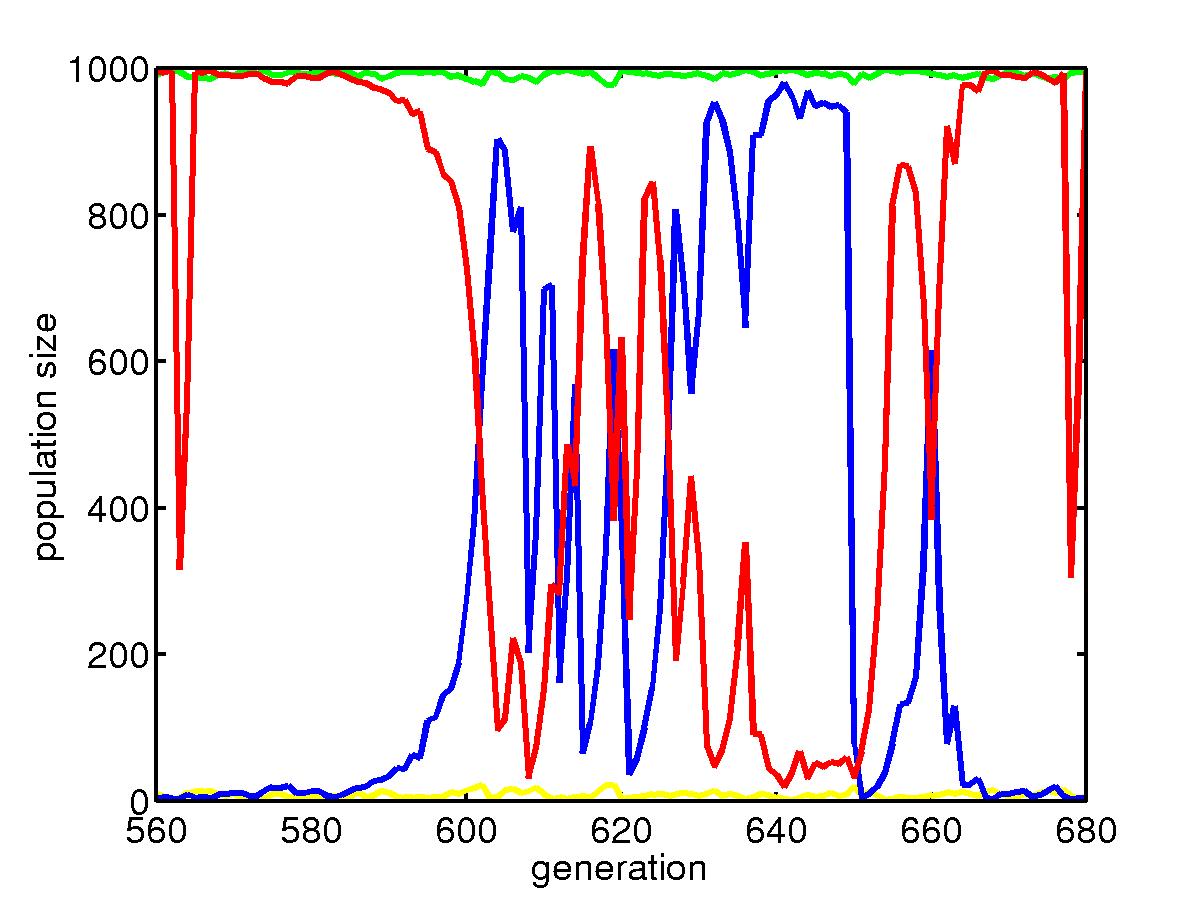
This is the process of population dynamics.
The green line is for slow mutators in the uniform niche, which dominate
that niche most of the time after the optimal configuration is found; the
yellow line is for fast mutators in the uniform niche, which is squeezed
to very low level because in uniform niche, they do not face new environments.
The red line is for slow mutators in the skewed niche, they also dominate
that niche. However, a rare event can cause the population go extinct
and after picking up configuration from the uniform niche, fast mutators
outperform when they change the configuration to fit the new environment.
But later when better configuration is found, slow mutators again take
over the niche. Below is a portion of the above plot where we see
a transition.