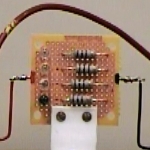
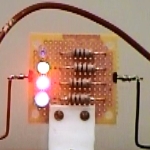
In the center of the photograph above is small circuit board that has four LEDs, each connected in series with a current-limiting resistor. The four LED-resistor pairs are connected in parallel, and they are connected across both the output of a variable (DC) power supply and the input of a voltmeter. Each LED emits a different color. One emits in the IR (940 nm), the second emits in the red (660 nm), the third emits green (568 nm), and the fourth emits blue (468 nm). As you slowly raise the voltage from zero, the LEDs light up in sequence, each at a different voltage, which corresponds to the energy of the light emitted by the LED. By plotting the energy of the light vs. c/λ, you can obtain Planck’s constant as the slope of the line. You could simply calculate it as λE/c for each wavelength, but the values obtained this way could be more sensitive to any systematic errors in the measurement than the slope of a fit line would be. The value that results is typically within 10 to 20 percent of the established value, depending on how you arrive at it, and you can obtain the data quickly enough that you can perform the whole process as a lecture demonstration.
How does it work ?
When current flows in an LED, electrons crossing the p-n junction can go from either an energy level in the conduction band or a donor impurity level, to either an an acceptor impurity level or an energy level in the valence band. In doing so, they emit photons having an energy that corresponds to the difference between the two levels. (Please see demonstration 64.56 Light-emitting diode (LED).) While there are subtleties involved in determining the exact correspondence of these energy gaps to the energy of the light emitted by the electrons as they cross them, for example, the exact shapes of the energy levels in which the electrons sit, the nature of the energy distribution among the electrons crossing the gap, how well one can determine when the LED just starts to light (vide infra), etc., the agreement of the results of the demonstration with the established value of Planck’s constant is good enough that this is a useful and pleasing demonstration.
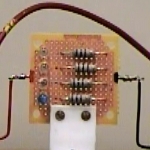
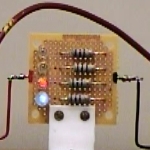
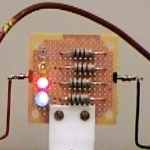
To perform the demonstration, starting with the power supply at zero, slowly raise the voltage across the LED circuit until the desired LED just begins to glow. You can have the students participate in determining when a particular LED has begun to glow. For the IR-emitting LED, you will need a camera (or other device) whose sensing element responds to near IR. The color video camera we use for some of the smaller demonstrations responds to the light emitted by this diode. The photographs below are stills extracted from video taken with this camera. They show the LEDs at zero volts, and at the voltages for which each one in turn begins to glow.
A typical set of voltages (measured across the whole circuit) for the LEDs as shown above, in respective order, is 0 V, 1.19 V, 1.50 V, 1.80 V and 2.36 V. A volt is a N·m/C, or a J/C. A single electric charge, e, is 1.602 × 10⁻¹⁹ C, and the corresponding unit of energy is the electron-volt (eV), or (1.602 × 10⁻¹⁹ C)(J/C), or 1.602 × 10⁻¹⁹ J. The voltages above thus correspond to electron (and thus photon) energies of 1.70 × 10⁻¹⁹ J, 2.40 × 10⁻¹⁹ J, 2.85 × 10⁻¹⁹ J and 3.78 × 10⁻¹⁹ J.
The energy of a photon, E, equals hν, where ν is the frequency of the light, or hc/λ, where λ is the wavelength of the light. h is Planck’s constant, and c is the speed of light. (Please see demonstration 88.09 -- Photoelectric effect.) Rearranging, we get h = λE/c, which gives Planck’s constant as determined by the four photon energies as: (9.40 × 10⁻⁷ m)(1.91× 10⁻¹⁹ J)/2.998 × 108 m/s = 5.98 × 10⁻³⁴ J·s (IR), (6.60 × 10⁻⁷ m)(2.40 × 10⁻¹⁹ J)/2.998 × 108 m/s = 5.29 × 10⁻³⁴ J·s (red), (5.68× 10⁻⁷ m)(2.88× 10⁻¹⁹ J)/2.998 × 108 m/s = 5.46 × 10⁻³⁴ J·s (green) and (4.68× 10⁻⁷ m)(3.78× 10⁻¹⁹ J)/2.998 × 108 m/s = 5.90× 10⁻³⁴ J·s (blue). The accepted value for Planck’s constant is 6.626 × 10⁻³⁴ J·s, which gives an error of about -10%, -20%, -18% and -11%, respectively, for the values above. A least-squares linear fit of these data gives a regression line with a slope of 5.79 × 10⁻³⁴ J·s, which is about 12% low. (The average of the individual calculations is 5.66 × 10⁻³⁴ J·s, which is about 15% low.)
As noted, the measurements above are voltages across the whole circuit of LED-resistor pairs. If the current through a given LED is significant, the voltage developed across the resistor could cause the actual voltage across the LED to differ from the measured voltage. For the measurements in this example, the voltages across the LEDs themselves were 1.06 V, 1.50 V, 1.78 V and 2.36 V, respectively. So for the IR and green LEDs, the measured voltages were high by 12% and 1%, respectively, and for the red and blue LEDs, there was no noticeable difference. So for these LEDs, we should calculate values for Planck’s constant of (9.40 × 10⁻⁷ m)(1.70 × 10⁻¹⁹ J)/2.998 × 108 m/s = 5.32 × 10⁻³⁴ J·s and (5.68× 10⁻⁷ m)(2.85× 10⁻¹⁹ J)/2.998 × 108 m/s = 5.40× 10⁻³⁴ J·s, which are in error by about -20% and -18%, respectively. The slope of the regression line with these measurements substituted for their respective values above is 6.410 × 10⁻³⁴ J·s, which is only about 3% low. (The average of the individual calculations is 5.48 × 10⁻³⁴ J·s, which is about 17% low.)