
 |
 |
Why NFFL Fuel Model 4 Does Not Accurately Predict the Rate of Fire Spread through Chaparral in the Santa Monica Mountains
The United States National Fire Behavior Prediction System is centered around a semi-empirical model of fire spread developed by Rothermel in 1972. The fire spread model requires detailed stand-level vegetation properties in order to accurately predict the rate of fire spread. The National Forest Fire Laboratory (NFFL) has developed 13 standard fuel models meant to span the range of variability in fuel types across the United States (Anderson, 1982). Each fuel model simplifies the process of estimating fire behavior through a particular area by providing suggested reasonable values for the properties required of the fire spread model. Of the 13 models, three have stated applicability to shrub fuels (NFFL 4, NFFL 5, and NFFL 6). Because Anderson specifically recommends the use of NFFL 4 in Southern California chaparral fuel types, this fuel model has been in widespread use in chaparral.
The NFFL 4 fuel model values were not based upon field inventory or empirical measures of fire spread, but instead were developed by fitting fire behavior predictions from the Rothermel fire spread model to the fire behavior that was expected in chaparral (J Regelbrugge, personal communication). In retrospect, this approach has had several negative consequences. Foremost is that the predictions of fire spread provided by the Rothermel fire spread model with NFFL 4 are far in excess of what is observed in virtually all but the most extreme fire situations (Van Wilgen, 1985).
Aside from the flaws in the manner in which NFFL 4 was conceived, the fuels attributes used for this model are not consistent with fuels inventory data collected in the Santa Monica Mountains. A subset of the aforementioned fuel properties, termed the fuel load, describe the amount of accumulated fuel biomass that is present in a stand. The accumulated total biomass and accumulated fuel biomass are not the same. Accumulated total biomass includes all of the vegetative material, both living and dead, whereas the fuel biomass refers only to some fraction of this amount. The distinction is necessary because not all of the biomass in a stand contributes to the forward rate of spread of the fire. The contribution of individual fuel particles to fire spread can be evaluated based upon the surface area to volume (SAV) ratio of the fuel particle. The larger the SAV, the more readily the particle absorbs heat and subsequently ignites. Because fuel particles with the lowest SAV also tend to be large, a good example is a tree trunk, the biomass of these particles is excluded from measurements of fuel biomass. Chaparral stands are shrub-dominated and tend be devoid of low SAV fuels like tree trunks, and consequently much of the biomass in a chaparral stand is available as fuel. Fortunately, field inventory data has been collected in the Santa Monica Mountains that enable the calculation of total aboveground biomass as well as the subset of this biomass that is available as fuel. By comparing the fuel load estimates from the field inventory with the values used in NFFL 4 the glaring discrepancies between the two become obvious.
NFFL 4 Fuel Load Attributes
|
Dead1 Hour |
Dead10 Hour |
Dead100 Hour |
Live Herb |
Live Woody |
Total Fuel Biomass |
|
11.23 |
8.99 |
4.51 |
0.00 |
11.21 |
35.94 |
All values shown are in Mg/ha.
Average Fuel Load for All Stands Dominated By Ceanothus-Type Chaparral
|
Dead1 Hour |
Dead10 Hour |
Dead100 Hour |
Live Herb and Woody |
Total Fuel Biomass |
|
7.13 |
5.60 |
2.11 |
17.09 |
31.93 |
All values shown are in Mg/ha.
Average reflects field inventory data collected at 5 sites by J Regelbrugge of the USDA Forest Service (1995-1997).
Range of Total Fuel Biomass: 17.90 Mg/ha.
Average Fuel Load for All Stands Dominated By Adenostoma-Type Chaparral
|
Dead1 Hour |
Dead10 Hour |
Dead100 Hour |
Live Herb and Woody |
Total Fuel Biomass |
|
3.21 |
3.36 |
0.00 |
10.62 |
17.19 |
All values shown are in Mg/ha.
Average reflects field inventory data collected at 3 sites by J Regelbrugge of the USDA Forest Service (1995-1997).
Range of Total Fuel Biomass: 4.50 Mg/ha.
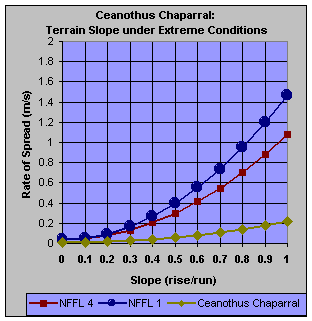
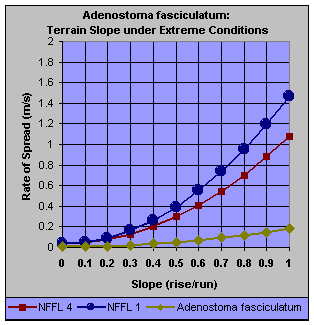
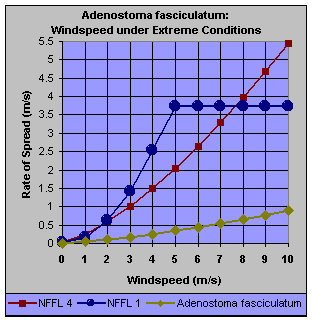
Although the difference in the value of 'Total Fuel Biomass' between NFFL 4 and the inventory data collected in Ceanothus-dominated stands appears relatively small (35.94 Mg/ha versus 31.93 Mg/ha), this does not translate to similarities in predicted fire behavior. Instead, the discrepancy in the fraction of biomass that represents living fuels is what deserves the most attention. Why? Dead fuels absorb and lose water throughout the day as the temperature and relative humidity of the ambient atmosphere fluctuate. In contrast to dead fuel biomass, the moisture content of the live fuels is regulated by the host shrub. As a result, live fuels contain far more liquid water per unit of mass than dead fuels. Because the liquid water in these fuels must be vaporized (raised to the boiling point of water and then have their phase changed from a liquid to gas) prior to the ignition of the fuel particle, live fuels require a significantly greater amount of energy to ignite than dead fuels. These observations explain why the predicted fire behavior between NFFL 4 and the inventory data is so different. The live fuels in the inventory data act as a "heat sink" and significantly subdue the rate of spread as compared to NFFL 4. This effect is observed in the graphs of predicted rate of spread under conditions of increasing slope and increasing windspeed. The "extreme" environmental conditions used to generate these predictions are described in detail on the Fuels Analysis page. The degree to which NFFL 4 drastically overpredicts the rate of spread in comparison to fuel models developed from inventory data is evident by examining the graphs below.
Fire Spread Predictions

|

|

|

|
|
|