The signal generator places a 7-Hz sine wave on the primary of the transformer and the X input of the oscilloscope. The Y input of the oscilloscope measures the voltage across the transformer secondary. The oscilloscope is in X-Y mode; Channel 1 of the oscilloscope goes to the horizontal deflection plates, and Channel 2 goes to the vertical deflection plates. This yields a plot of Channel 2 voltage vs. Channel 1 voltage instead of a voltage vs. time plot.
The sinusoidal voltage applied to the primary of the transformer forces a sinusoidal current through it, which gives rise to an oscillating magnetic field. This in turn induces a sinusoidal voltage across the secondary of the transformer, forcing a sinusoidal current through it. The main focus of this demonstration is not the induction itself, but, rather, the magnetization of the iron core of the transformer by the oscillating magnetic field set up by the primary. The magnetic domains in the iron core align themselves with this magnetic field, so that their magnetic fields add to it. (See demonstrations 72.54 -- Inductor spark, and 72.69 -- Large component LRC circuit.) This increases the total magnetic field, and thus improves the coupling between the primary and secondary.
As the title of this demonstration indicates, its purpose is to show the phenomenon of hysteresis, which arises from the ferromagnetic behavior of the iron core of the transformer.
Below are two oscilloscope traces for this demonstration. The one at left is with normal display settings on the oscilloscope, and the one at right is with persistence turned on. The trace should be clearly visible to the class with normal settings, but if you desire a brighter trace than what you can obtain by means of the intensity control, you can turn persistence on (via the “Display” button).
The dotted line drawn on the trace at left shows approximately the initial first quarter cycle of the voltage applied to the primary (assuming that we begin at the start of the cycle). During this quarter cycle, the voltage, and hence the current, goes from zero to its maximum value, and the core becomes magnetized in the direction of the resulting magnetic field. In the next quarter cycle, the current decreases from its maximum back to zero, corresponding to the portion of the trace going from the top right corner to the y-axis, about one division above the x-axis. (The y-axis has a marker at the top, to show the zero for the X voltage, and the x-axis has a marker at left, to show the zero for the Y voltage.) At this point, the current reverses, going to a maximum in the opposite direction at the lower left corner of the trace. This magnetizes the core in the opposite direction. In the last quarter cycle, the current decreases to zero, again at the y-axis, a little over one division below the x-axis. In beginning the next cycle, the current reverses again and goes to its maximum, which gets us back to the top right corner of the trace, and the original direction of magnetization of the core.
If the iron core of the transformer became magnetized and demagnetized instantaneously with the changes in the applied magnetic field, the output voltage should track exactly with the input voltage, and we should obtain a sort of S curve, like the dotted line in the left trace, inverted through the origin; the curve should retrace itself. With ferromagnetic materials, however, this does not happen. This is the aforementioned phenomenon of hysteresis. It arises from the permanent magnetism that ferromagnetic materials can exhibit. If we examine the hysteresis curve, we notice that where the trace crosses the y-axis, even though the input voltage, and hence the current, is zero, the output voltage is not. This is because the domains in the iron core, which have been aligned by the applied magnetic field, do not return completely to their original positions when the field is removed, so that the core retains a magnetic dipole. Thus, as the oscillating magnetic field alternately aligns the domains in the iron core in opposite directions, there is a lag between the applied magnetic field and the reorientation of the domains, and thus also between the voltage applied to the primary and the voltage induced in the secondary.
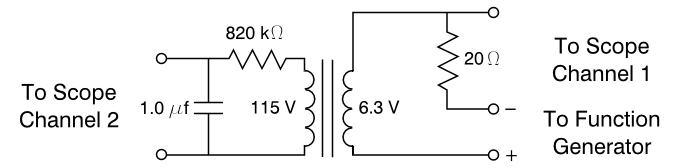
The schematic for this demonstration is:
An overhead transparency of this schematic is available for you to display in class, or you may download a .pdf version here to show on the data projector.
References:
1) Halliday, David and Resnick, Robert. Physics, Part Two, Third Edition (New York: John Wiley and Sons, 1977), pp. 825-828.