|
Before analyzing a variety of simulated fire regimes, we sought to validate that HFire could recreate fire histories similar to those observed in reality. Preliminary validation of HFire in the Santa Monica Mountains (SAMO) therefore required identification of baseline parameter settings that generated realistic fire patterns. Because there are many possible combinations of input parameters that could result in reasonable output, the baseline values must also be realistic for this region and the size of the simulation domain.
Derivation of baseline parameter settings is described in the sections below, and baseline output is discussed at the end of this page.
Ignitions
Long-term simulation of fire regimes requires that the user specify an annual rate of ignitions on the landscape. An "ignition" can be any source of fire, regardless of whether or not it propagates beyond its initial location. The vast majority of ignitions do not become "fires," either because they are quickly extinguished or because they go out before igniting something that will allow further fire spread. The mapped fire history for SAMO includes only the largest fires, so it is not possible to estimate the average number of ignitions per year from this dataset. However, Los Padres National Forest (LPNF) is a nearby shrubland-dominated region with an excellent record of ignitions, allowing one to calculate a rough estimate of ignition rates for a region the size of SAMO.
On average, the shrublands of LPNF have experienced a total of ~0.37 ignitions per square km over the period 1911-1995. For a region the size of SAMO (i.e., ~900 square km), this equates to an average ignition rate of ~4/yr. However, it is likely that some fraction of ignitions in LPNF have gone unreported, leading to annual ignition rates that are probably somewhat higher. In addition, large expanses of LPNF are unroaded wilderness, while SAMO is more heavily roaded and embedded in the densely populated Los Angeles area. For these reasons, we estimate that the average rate of ignitions for SAMO is substantially higher than 4 per year, and we settled on a value of 8 for the baseline simulation runs.
|
|
Weather
HFire allows one to specify the average number of extreme fire weather events per year, as well as how many days long each should be. Remarkably, there is little published information about the frequency and duration of extreme fire weather in different parts of California that one could use in determining a baseline rate for these parameters.
A relatively old but comprehensive study of extreme fire weather (Schroeder et al. 1964) documented that Santa Ana wind events occurred 58 times over 1951-1960, during what we use as the "fire season" for simulations (i.e., months of July through November). This equates to a rate of ~6/yr, several more than the number we identified in the 1998 and 1999 fire seasons (i.e., 5 events combined). As a reasonable approximation for the SAMO region, we initially chose an annual average rate of 4 Santa Ana events. We specified each event to be 4 days in length (average in Schroeder et al. 1964 was 3.5 days).
Schroeder, M.J., M. Glovinsky, V.F. Hendricks, F.C. Hood, M.K. Hull, H.L. Jacobson, R. Kirkpatrick, D.W. Krueger, L.P. Mallory, A.G. Oertel, R.H. Reese, L.A. Sergius, and C.E. Syverson. 1964. Synoptic Weather Types Associated with Critical Fire Weather. U.S. Forest Service, Pacific Southwest Range and Experiment Station.
|
|
Suppression
Identifying a baseline value for the extinction rate of spread threshold is difficult, because there is little published information about what this rate should be. In addition, the baseline rate must be one that generates realistic fire patterns under a variety of weather conditions and in different vegetation types, despite the fact that such an extinction threshold should probably vary.
After preliminary tests of the model, we have chosen a baseline spread threshold of 0.033 m/s, which is ~6 chains/hr. This is a reasonable estimate, based on discussions with various fire behavior personnel, other fire simulation work in shrublands (e.g., Davis and Burrows 1993, Davis and Michaelsen 1995), and comparison of model output with mapped fire histories.
Davis, F.W. and D.A. Burrows. 1993. Modeling fire regime
in Mediterranean landscapes. Pages 247-259 in S. Levin, T. Powell, and
J. Steele, editors, Patch Dynamics. Springer-Verlag Lecture Notes in Biomathematics,
New York.
Davis, F.W. and J. Michaelsen. 1995. Sensitivity of fire regime in chaparral
ecosystems to climate change. Pages 435-456 in J.M. Moreno and W.C. Oechel,
editors, Global change and Mediterranean-type ecosystems. Springer-Verlag
Ecological Studies v. 117, New York, New York, U.S.A.
|
|
As a validation of
our parameter choices, simulated fire regimes should:
1) consist of realistic fire patterns on the landscape,
2) generate reasonable fire return intervals, and
3) approximate historical fire size distributions.
Fire
patterns:
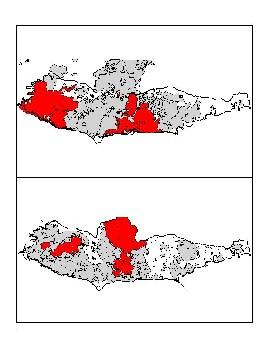
Select the figure below
to see a comparison between real (top) and simulated (bottom) fire histories.
Both real and simulated fires are relatively compact and space-filling (as opposed to fractal). Both also show some of the same areas that tend not to burn very often. The real fire history for SAMO only records a few fires smaller than 100 ha, while the simulated output includes fires of all sizes.
Fire
return intervals:
Shrubland vegetation
is relatively sensitive to fire return intervals that are too short, which
can result in type-conversion of native plant species. It is therefore
important that simulated fire intervals be within a range that allows
persistence of natural vegetation.
"Fire cycle" is a measure often used to approximate how long average fire intervals are across the landscape. Fire cycle is calculated as the number of years it would take to burn an area equivalent to the size of the simulation domain (i.e., ~900 square km), based on average annual burning rates. Using the baseline parameter settings discussed above, average fire cycles are ~33 yr. This interval length is close to that observed for some shrubland ecosystems (e.g., Los Padres National Forest), although it is not far from intervals that could risk type conversion (e.g., < 25 yr).
Fire
size distributions:
One of our goals has
been to analyze the sensitivity of fire size distributions to changes
in various parameters; therefore, it is important that baseline settings
generate fire regimes that approximate historical distributions.
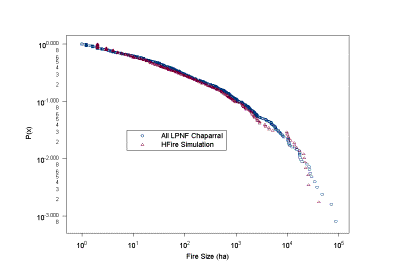
Because the mapped fire history for SAMO is quite short and incomplete, it was not useful for this step in the validation process. As was the case for ignitions (above), the mapped fire history of LPNF was used in assessing the baseline simulation settings. Select the figure below to see a comparison between simulated fire size distributions and those characterizing historical data. Simulated fire regimes approximate those observed in real shrublands to a remarkable degree.
|
Last updated: <February, 2003>
|

